Jump to content


Photo

MacleodFinance Substack et al.


  • Please log in to reply
83 replies to this topic

#41 Carlos77

Carlos77

    Member

  • Traders-Talk User
  • 80 posts

Posted 20 February 2024 - 10:58 AM

The Pain in Silver & Gold Is Almost Over


February 15, 2024

 
I am going to change things up this week by starting with the conclusion. I believe Silver is about to bottom below $22 but above $20, most likely with a $21 handle. Gold will follow somewhere between $1962 to $1923, most likely around $1950.

In other words, one more lower low and up we go.

The levels to break on the upside in Silver to confirm the low is in place are the prior peaks at $23.15, $23.50 (200-DMA), and $23.72.

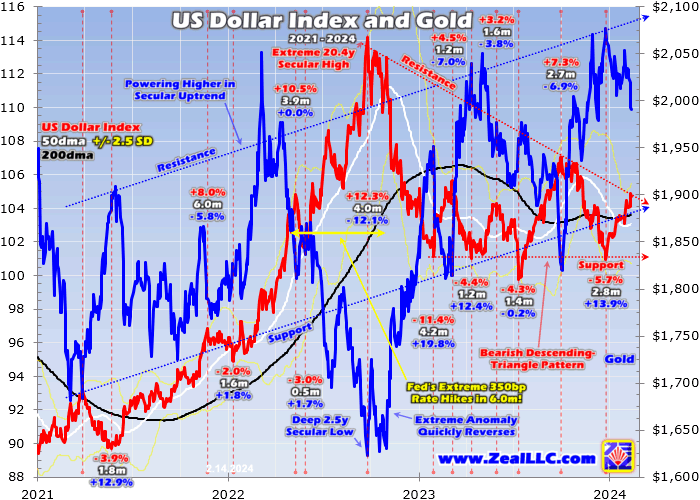
The same goes for Gold between $2040-$2060 and, of course, $2090.


POSITIONING OF THE FUNDS IN SILVER


The positioning of the Funds in Silver last Tuesday was already bullish, although it obviously allowed for slightly lower lows in price.


1-silver-last-tuesday.png


The Banks’ net position did not change much. It remained basically zero, neutral. This was bullish, but as I stated at the time, it could become even more bullish if the Banks decide to go long Silver.

Given the drop from $23.15 to $22 on Monday and Tuesday, aided by hawkish comments from Powell and the higher-than-expected Core CPI, it is not a stretch to believe that the Banks are now long. A further drop in price to a lower low and they are likely set up perfectly for a big rally.


More interesting was that the Funds (the dumb money in the chart above) went from 4k contracts net long to 5k net short last week. When the Funds are net SHORT, that is bullish. If the Banks now have gone from neutral to long, it is also likely that the Funds are even more short now with more to add if we hit a lower low. Again, extremely bullish for Silver. Not so good for the Funds—in the wrong place at the wrong time as always.

Suffice to say that the positioning alone suggests a bottom in Silver is imminent.


Turning to Gold…


2-gold-swaps.png


Banks increased their net short position by 7.5k to 144k contracts. This was the first increase in five weeks.

They increased their net short position even though the Gold price was flat. That was bearish short-term for Gold.

The fact that the Funds added 12k contracts and their net long position is now 68k is also bearish short-term.

But given that the Gold price was $2055 when this data was recorded and has since fallen to $2000, the Banks have probably cut their net short position while the Funds cut their net long position.


History shows that a net short position of 120k contracts or less would be sufficient for a major low. Could the Banks have reduced their net short position by 24k contracts since Feb. 6? Sure they could, especially if Gold falls further to $1950.


What is clear is that the positioning in Silver is far more bullish than that in Gold, and this is one of the reasons why I believe Silver will lead the next rally higher. The Gold:Silver ratio is going to head south, imho.


Read more


#42 Carlos77

Carlos77

    Member

  • Traders-Talk User
  • 80 posts

Posted 21 February 2024 - 04:39 AM

Dollar Throttling Gold


Adam Hamilton    

February 16, 2024


Gold’s 1.3% tumble back under $2,000 after that Fed-hawkish hotter CPI really spooked traders.  That was sure evident in the leveraged gold proxies of silver and the leading GDX gold-stock ETF plunging by 2.9% and 5.1% that day.  Absurdly those major gold stocks were crushed back down to early-October levels, when this gold upleg was born near $1,820!  Yet gold itself remained fully 9.5% higher after that CPI.

So the bearish impact on gold sentiment Tuesday was much worse than its down day warranted.  Being in the financial-newsletter business, I hear from lots of traders.  My e-mail traffic was pretty dejected after that CPI upside surprise, filled with worries gold was in trouble.  Several people even warned me about an ominous new gold downtrend!  That really piqued my interest, leaving me searching for it on the charts.


Longer-term price charts are the best tool for maintaining perspective, providing essential context for framing the latest market action.  Here gold is superimposed over the USDX during the last several years or so.  While gold’s post-CPI drop sure felt bad, it is barely noticeable in the grand scheme.  Gold is still way up near nominal record highs, with both its latest bull upleg and longer secular uptrend remaining intact.


Zeal021624A.gif


Gold doesn’t just look really bullish strategically, but tactically.  Since early October, gold’s latest upleg had surged 14.2% at best into late December’s latest nominal record high.  As of Wednesday, gold had only given back a third of those gains in its latest pullback.  Such selloffs are inevitable and essential within ongoing uplegs, bleeding off excessive greed to rebalance sentiment.  That’s necessary to keep uplegs healthy.

Even after that hotter CPI print, gold’s latest pullback is just down 4.2% over the past seven weeks or so!  That remains mild by gold-pullback standards, far from upleg-slaying 10%+ correction territory.  So those bearish gold-in-a-downtrend fears are flat-out wrong!  Gold remains just 4.3% under more record highs, it sure isn’t beaten-down.  And this dollar-gold chart reveals the reason gold has pulled back in recent months.


Gold is sure sensitive to USDX meanderings. The reason is gold-futures trading, which dominates gold’s near-term price action.  Understanding how this worksis essential if you want to trade gold, silver, and their miners’ stocks.  Leverage allowed in gold futures is extreme, running as high as 24.0x mid-week!  For traders daring to bet at that full 24x, a mere 4.2% gold move against their positions wipes 100% of their capital risked!  They can’t afford to be wrong for long.

That necessitates shrinking their trading time horizons to the ultra-short-term, days or maybe weeks on the outside.  They can’t care about gold’s bullish fundamentals including massive underinvestment and colossal global money-supply growth.  All that matters is what gold is likely to do immediately.  So these super-leveraged traders fixate on the US dollar’s fortunes, moving quickly to do the opposite in their trading.


So sharp gold-futures-driven gold selloffs really taint investors’ sentiment.  They see gold drop and grow bearish, even though heavy gold-futures selling is quite finite and quickly exhausts itself.  That yields to proportional normalization buying, so gold soon blasts back higher in symmetrical mean-reversion rallies.  This scenario played out in early October, when today’s upleg was birthed in anomalous gold-futures selling.

Surprisingly the Fed’s interest-rate levels aren’t too important for gold.  Before the FOMC launched its monster rate-hike cycle in March 2022, I did a comprehensive study on gold’s behavior during all past Fed-rate-hike cycles of the modern monetary era since 1971.  Through the exact spans of all twelve of them, gold averaged excellent 29.2% gains!  It is the US dollar that is sensitive to rates, not gold directly.


Read more


#43 Carlos77

Carlos77

    Member

  • Traders-Talk User
  • 80 posts

Posted 21 February 2024 - 04:40 AM

Dollar Throttling Gold


Adam Hamilton    

February 16, 2024


Gold’s 1.3% tumble back under $2,000 after that Fed-hawkish hotter CPI really spooked traders.  That was sure evident in the leveraged gold proxies of silver and the leading GDX gold-stock ETF plunging by 2.9% and 5.1% that day.  Absurdly those major gold stocks were crushed back down to early-October levels, when this gold upleg was born near $1,820!  Yet gold itself remained fully 9.5% higher after that CPI.

So the bearish impact on gold sentiment Tuesday was much worse than its down day warranted.  Being in the financial-newsletter business, I hear from lots of traders.  My e-mail traffic was pretty dejected after that CPI upside surprise, filled with worries gold was in trouble.  Several people even warned me about an ominous new gold downtrend!  That really piqued my interest, leaving me searching for it on the charts.


Longer-term price charts are the best tool for maintaining perspective, providing essential context for framing the latest market action.  Here gold is superimposed over the USDX during the last several years or so.  While gold’s post-CPI drop sure felt bad, it is barely noticeable in the grand scheme.  Gold is still way up near nominal record highs, with both its latest bull upleg and longer secular uptrend remaining intact.


Zeal021624A.gif


Gold doesn’t just look really bullish strategically, but tactically.  Since early October, gold’s latest upleg had surged 14.2% at best into late December’s latest nominal record high.  As of Wednesday, gold had only given back a third of those gains in its latest pullback.  Such selloffs are inevitable and essential within ongoing uplegs, bleeding off excessive greed to rebalance sentiment.  That’s necessary to keep uplegs healthy.

Even after that hotter CPI print, gold’s latest pullback is just down 4.2% over the past seven weeks or so!  That remains mild by gold-pullback standards, far from upleg-slaying 10%+ correction territory.  So those bearish gold-in-a-downtrend fears are flat-out wrong!  Gold remains just 4.3% under more record highs, it sure isn’t beaten-down.  And this dollar-gold chart reveals the reason gold has pulled back in recent months.


Gold is sure sensitive to USDX meanderings. The reason is gold-futures trading, which dominates gold’s near-term price action.  Understanding how this works is essential if you want to trade gold, silver, and their miners’ stocks.  Leverage allowed in gold futures is extreme, running as high as 24.0x mid-week!  For traders daring to bet at that full 24x, a mere 4.2% gold move against their positions wipes 100% of their capital risked!  They can’t afford to be wrong for long.

That necessitates shrinking their trading time horizons to the ultra-short-term, days or maybe weeks on the outside.  They can’t care about gold’s bullish fundamentals including massive underinvestment and colossal global money-supply growth.  All that matters is what gold is likely to do immediately.  So these super-leveraged traders fixate on the US dollar’s fortunes, moving quickly to do the opposite in their trading.


So sharp gold-futures-driven gold selloffs really taint investors’ sentiment.  They see gold drop and grow bearish, even though heavy gold-futures selling is quite finite and quickly exhausts itself.  That yields to proportional normalization buying, so gold soon blasts back higher in symmetrical mean-reversion rallies.  This scenario played out in early October, when today’s upleg was birthed in anomalous gold-futures selling.

Surprisingly the Fed’s interest-rate levels aren’t too important for gold.  Before the FOMC launched its monster rate-hike cycle in March 2022, I did a comprehensive study on gold’s behavior during all past Fed-rate-hike cycles of the modern monetary era since 1971.  Through the exact spans of all twelve of them, gold averaged excellent 29.2% gains!  It is the US dollar that is sensitive to rates, not gold directly.


Read more


#44 Carlos77

Carlos77

    Member

  • Traders-Talk User
  • 80 posts

Posted 22 February 2024 - 08:16 AM

Mainstream Money Tiptoes Into Gold Miners

16.02.2024
 

The appeal of mining stocks is that they’re “leveraged bets on the underlying commodity.” So you’d think that with gold not far from an all-time high, the big gold miners like Newmont and Barrick would be crushing it. But the opposite has been true lately, as these stocks have become almost ridiculously unloved. 

 
https%3A%2F%2Fsubstack-post-media.s3.ama
 
Two possible conclusions can be drawn from this: Either the relationship between gold and its miners is fundamentally broken, or this divergence is signaling an opportunity. One way to decide is to look at the miners’ earnings. If they’re making lots of money from $2000 gold, then the operational side of the story is intact, and share prices should follow. If not, not.
 
Newmont’s Q4 earnings are due out next week, but Barrick’s were just released: Barrick Gold Posts Q4 Earnings Of $479 Mln; Declares Dividend, Plans Up To $1 Bln Share Buyback
 

(RTTNews) - Barrick Gold Corp. (GOLD, ABX.TO) reported Wednesday that its fourth-quarter net earnings attributable to equity holders of the Company were $479 million or $0.27 per share.

Sequentially, net earnings grew 30 percent from $368 million or $0.21 per share in the preceding third quarter.

Adjusted net earnings were $466 million or $0.27 per share, compared to $418 million or $0.24 per share in the previous quarter.

Revenues were $3.06 billion, up 7 percent sequentially.

Further, Barrick announced the declaration of a dividend of $0.10 per share for the fourth quarter of 2023. The dividend will be paid on March 15, to shareholders of record at the close of business on February 29.

Barrick also announced that its Board of Directors has authorized a new program for the repurchase of up to $1.0 billion of the Company's shares over the next 12 months.


At least for Barrick, a rising gold price still translates into higher earnings, increased dividends, and continued share buybacks. So far, so good.


Generalist Investors See The Opportunity


Now comes the tricky part, where non-gold-bug investors notice the combination of positive financial trends and underperforming stocks and conclude that the miners are value players. That too is starting to happen: Druckenmiller bets on the world’s two largest gold producers


According to updated F-13 regulatory filings, Stanley Druckenmiller’s Duquesne Family Office dumped its holdings in Google’s Alphabet (Nasdaq: GOOGL), Alibaba Group (NYSE: BABA) and Amazon (Nasdaq: AMZN) in the fourth quarter of 2023.
As Druckenmiller has pared back his exposure to the tech and e-commerce sectors, he has placed new, albeit smaller, bets in the mining sector. The filings show the investment office bought 1.76 million shares of Barrick Gold (NYSE: GOLD) and 474,000 shares of Newmont Mining (NYSE: NEM). At the same time, they increased their exposure to Teck Resources (NYSE: TECK), which represents the fifth biggest investment in the portfolio.


A big name like Druckenmiller buying gold miners gives other generalist investors permission to do the same thing, so it’s easy to envision a time in which some of the profits now being taken in Big Tech flow in this direction. 

A lot of miners will report their Q4 results in the coming month, validating (or not) the thesis that rising gold translates into rising miner earnings. Newmont’s February 22 report will be a big one, so stay tuned.


https://rubino.subst...ptoes-into-gold


#45 Carlos77

Carlos77

    Member

  • Traders-Talk User
  • 80 posts

Posted 23 February 2024 - 05:05 AM

Keynesian credit creation meets its Armageddon

Or how runaway government debt threatens to collapse the entire credit system


MACLEODFINANCE

22.02.2024
 

Few commentators are aware that the dynamics leading to an inevitable collapse of credit are increasing. When these dynamics begin to unfurl, there is bound to be a global rush out of fiat credit into gold. This is why prescient central banks have been accumulating bullion.


This week, the more observant among us will have detected a fork in the road of credit creation. Major nations are now officially in recession, suggesting that interest rates should be reduced according to the Keynesian playbook. But inflation is showing signs of rising again, mandating the opposite. These are a rerun of the conditions which discredited Keynesianism in the 1970s, leading to a common description of something that was to statist economists impossible: stagflation.


The only reason that the US is not in an official recession is the massive amounts of government spending in excess of tax revenue: in other words, it is printing its way out of recession. Inevitably, this will continually undermine the dollar’s purchasing power even further, an effect which feeds into the inflation pipeline. Any hopes of a sustainable reduction in interest rates can be dismissed on these grounds alone.


The US is not the only nation with this problem. Intractable budget deficits abound in the UK, Japan, and Europe as well. According to the Institute of International Finance, global government debt has increased from $33 trillion in 2008, to $71 trillion before the covid crisis three years ago, to $90 trillion today. With interest rates and borrowing costs having also risen inexorably, global government debt has gone parabolic.


https%3A%2F%2Fsubstack-post-media.s3.ama


In inflation creation terms, the US and 9% budget deficit is the worst offender. That is likely to be the trigger destabilising the finances of the other nations on the list.


https://alasdairmacl...ation-meets-its


#46 Carlos77

Carlos77

    Member

  • Traders-Talk User
  • 80 posts

Posted 24 February 2024 - 04:20 AM

Currency Wars And Their Effect On Gold And Silver Prices


Dave Kranzler

Posted 21st February 2024


Introduction to Currency Wars


Currency wars, characterised by competitive devaluations, are not a novel strategy. They have been a tool used by nations throughout history to gain a trade advantage. 

This economic tactic often emerges in times of widespread financial distress, when several countries implement policy decisions to devalue their fiat currencies and boost their economies by making their exports cheaper. In addition, devaluing a currency increases the expense of imported goods. In a sense, currency wars are a form of trade wars. 


Historical Analysis of Currency Wars and Precious Metals


One major historical example of a currency war was during the 1930s, triggered by the Great Depression. Countries abandoned the Gold Standard, leading to a devaluation race to revive their struggling economies. 

The United States, under President Franklin D. Roosevelt, devalued the dollar in 1933 by 75% against the price of gold, leading to a significant rise in gold prices. This era vividly illustrates how currency devaluation can enhance the appeal of gold as a store of value.


Another example is the competitive devaluations that occurred in the late 1960s and early 1970s, leading up to the collapse of the Bretton Woods system. As countries like the United States and the United Kingdom devalued their currencies, there was a marked shift towards gold as a hedge against currency instability, culminating in the end of the dollar’s convertibility into gold in 1971.


More recently, the 2010s saw what some economists term as a ‘modern currency war,’ initiated after the 2008 financial crisis. To stimulate the economies, many countries including the US, Europe, and Japan engaged in aggressive monetary easing which in turn devalued their currencies. This currency devaluation was reflected in price inflation and higher precious metals prices. As such, this period witnessed a new record high in gold, and a near-record price for silver, thereby reaffirming their status as safe-haven assets.


In the current scenario, the aggressive monetary policies by central banks worldwide, coupled with geopolitical tensions and trade disputes, bear the hallmarks of a currency war. This economic milieu has direct implications for gold and silver. As history has shown, in times of currency devaluation, these precious metals regain their allure. Gold, in particular, has been a beneficiary of currency wars, as investors flock to it as a hedge against currency devaluation and inflation.

Silver, while often overshadowed by gold, also gains from its dual role as an industrial metal and a precious metal. Silver was the world’s first reserve currency. The rising industrial demand, coupled with its value as a monetary asset, positions silver favourably in times of currency turmoil.


Read more


#47 Carlos77

Carlos77

    Member

  • Traders-Talk User
  • 80 posts

Posted 25 February 2024 - 04:57 AM

The Next Financial Crisis Could Trigger A Bitcoin Revolution


Submitted by QTR's Fringe Finance

SATURDAY, FEB 24, 2024


I added my predictions about foreign money and other nation states pouring into bitcoin: "You got this conference that just happened in Dubai last week where you see like all these ultra-rich people, and I don't mean like, 'Hey, I live in a nice mansion in New Jersey, and I drive a Mercedes-Benz.' Like, I have four Bugattis and a pet tiger."


"That is wealth on a different level," I continue. "That is Saudi Aramco wealth. That is, 'I live on top of an oil well' wealth, right? These people are just looking for something to do with their money. They have more money than they know what to do with. They're gold plating water slides at water parks and building entire cities in the middle of the desert."


"If you think some of these guys are not going to allocate $20 billion, $25 billion to their sovereign balance sheets in the Middle East, even if it goes to zero, they don't give a f***. You know, they want to be trendy; they want to be on the next wave, whatever it is. They don't even have to understand it. So, it's almost better that they don't understand it. You know, they just say, 'Alright, well, it's this flashy thing. We want to get some of it. Maybe we'll hold a trillion dollars in gold, 10 billion dollars in Bitcoin.' But I think when that kind of stuff happens, the game theory just takes over, and it's Katie bar the door."


"Jim Chanos said to me sometime years ago, 'You know, this is an unprecedented experiment in monetary policy. We've never done this before.' And so, is it really that ridiculous to think that we're going to have an unprecedented outcome? No, it's not. So, what does an unprecedented outcome mean? It means something is going to happen that we don't expect to happen," I concluded. 


Read more


#48 Carlos77

Carlos77

    Member

  • Traders-Talk User
  • 80 posts

Posted 27 February 2024 - 11:50 AM

The Long View: COMEX Precious Metal Prices in 2024​


February 21, 2024

By Craig Hemke


I'll cut to the chase: I'm just not looking for huge gains this year. Next year? YES! This year? I think we should be content with something closer to what has been "average" so far this century.


3-gold-monthly-candlestick-chart.png


When can we feel confident and almost certain that the next leg upward has begun? Spot gold needs a monthly close above $2070 before anyone should begin to get excited. Beyond that, a monthly close above the $2120 intramonth high of December last year and it's on.


All of us who have held physical silver for over a decade are patiently awaiting the next bull market. When will it begin? When price breaks out above $28. Simply put, if the bullion bank trading desks are getting net long at $22 silver, maybe you should consider that level as a floor for your dip-buying too.

The chart below is quite clear. The breakout above $28 is coming. Of that you can be certain. But check the timing. Does it appear to you that you should expect this breakout before late summer or autumn of this year? In fact, I don't think we should expect it before next year.


4-Silver-monthly-candlestick-chart.png


Read more


#49 Carlos77

Carlos77

    Member

  • Traders-Talk User
  • 80 posts

Posted 28 February 2024 - 07:21 AM

Investor's Guide to Silver


Carlo Alberto De Casa

Posted 23rd February 2024


KEY TAKEAWAYS

  • Central bank decisions in 2024 continue to be pivotal for the silver market. These decisions can significantly influence market dynamics and investor sentiment.
  • Technical analysis indicates critical thresholds for silver prices. A drop below the support range of $21.9 to $22 could lead to further declines. Conversely, a resurgence above the $23.2 resistance level may create opportunities for gains.
  • Silver’s physical demand remains exceptionally strong, primarily fuelled by its applications in photovoltaics, electric vehicles, and 5G technology. This robust demand underpins silver’s integral role in modern industries.
  • Mexico, as the leading producer of silver, plays a crucial role in the global silver market. However, regulatory changes introduced in 2023 by the Mexican government could decrease the country’s appeal to mining companies. These changes have medium to long-term implications on silver’s pricing and availability.

Read more


#50 Carlos77

Carlos77

    Member

  • Traders-Talk User
  • 80 posts

Posted 29 February 2024 - 03:35 AM

A tale of two markets


Feb 23, 2024

Alasdair Macleod


Technical conditions for gold and silver differ radically.

In silver, Comex’s Producers & Merchants category is net short of over 31,000 contracts, representing 155 million ounces. This is because over 50% of mine production has silver as a secondary metal to copper, zinc etc., so it makes sense to hedge price volatility.

With this category taking the short side, it permits the Swaps to job a more even book, reflected in the chart below. 


image_8189a1b7fc.png


In fact, on the last Commitment of Traders figures (13 February), Swaps were net long of 1,822 contracts, while the hedge funds (Managed Money) were net short of 8,983 contracts. 

 
image_a3b735d001.png
 
We can see how this category can easily go even more short, historically as much as 50,000 contracts. So while hedge funds going net short and the Swaps going net long is a good oversold indicator, it is too early to say that silver’s price will find support at current levels.
Accordingly, traders would be wise to await further developments.
 
 
Meanwhile, the position in the Comex gold contract is markedly different. The Producer & Merchant category here is barely net short, compared with the past. With underlying credit and monetary developments likely to guarantee gold’s value, they are in no hurry to hedge. This is plain to see in my next chart.
 
image_79a76f9296.png
 
This leaves the burden of the short side to the Swaps, which is why they cannot close down their short positions:
 
image_ef0aed3bc8.png
 
As can be seen, despite the collapse in Open Interest, gross Swap shorts are $40bn between 23 traders (averaging $1.74bn each) and the longs are $15.75bn between 24 traders (averaging $66 million).

Open interest in this contract has virtually collapsed, which is next.


image_f27c4bfdb0.png


On this basis, we can say that gold is more oversold than silver


https://www.goldmone...-of-two-markets