Site Navigation


Advertisement

Turn Window for the Week of August 3rd & a Ruse by An...
According to my turn probability summation system, the day with the highest likelihood of seeing a turn in or acceleration of the current trend in the DJIA is Wednesday August 5th.
Last week the peak summation reading on Wednesday July 29th and relatively high readings the rest of the week saw a low on Wednesday and a couple of 1000 point whipsaw moves typical of this sort of uniform high turn summation reading week.

My bet on Warsh was on the mark - cluck, cluck, cluck - a poultry performance with no concrete action on inflation. The 30 year bond may finally be calling BS on the Fed inflation fight with the yield breaking to new highs in a nasty up trend. So far stocks, besotted with AI and all the funny money printing, have generally been ignoring the rise in rates, but at some point you would think this higher cost of doing business would start to bite.

At least the POTUS did his now widely expected weekend TACO to drive oil prices back down to help with inflation and of course to drive the DJIA up, although he's played the war-talk-progress card so many times that at some point it's not going to work any more. The futures Sunday night should tell if that ruse will still smell as sweet.
Regards,
Douglas


66 Views ·
0 Replies
Watching my boy Sully,excellent debate
on rates with, Yardeni, and Ranger Rick. its about time the debt topic was mentioned again and not all the usual BS. One of the things not mentioned in the debate is how we monetize inflation. Uncle Sam borrows money from creditors say its $1mill. Then Uncle Sam goes and prints a$1mill on his printing press (or some random number).Is the creditor really receiving $1mill. when he gets paid back? No, Uncle Sam borrows strong dollars and pays back weaker dollars. I really enjoyed about time the public heard that side of it. the conversation about real estate, these guys on TV can argues all they want, inflation is here to stay. (JMHO)
268 Views ·
2 Replies
( Last reply by pdx5 )
Rate hike?? That would probably be what I
would do. Inflation is here to stay.
132 Views ·
0 Replies

OT: Just turned 86 and still healthy, thanks to this dail...
https://youtube.com/...ts/cOZbElfBdCU?
27-28 min daily, except on days when I mow the large lawn with a push mower.
207 Views ·
0 Replies
Turn Windows for the Week of July 27th & Will He or W...
This week like last week has pretty high turn probability summation system readings just about every day with a peak on Wednesday the 29th, so not much help in calling turns. A whipsaw affair like last week is probable.
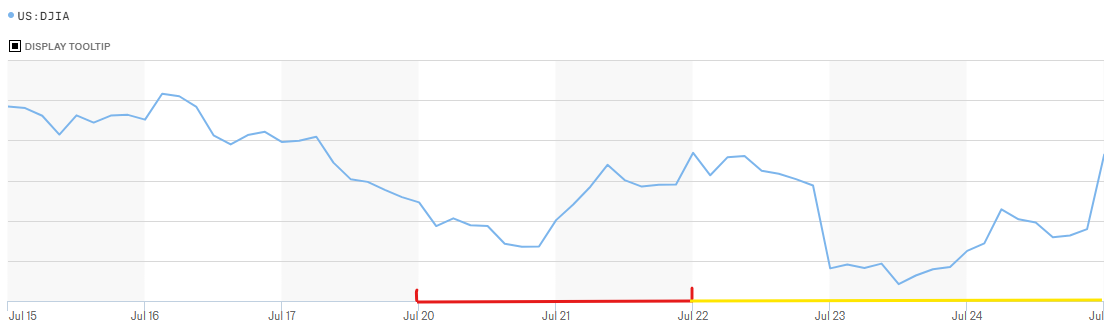
Last week, as I alluded to above, also had high system readings all week with peaks on Monday and Tuesday the 20th and 21st as shown in red in the marketwatch.com plot excerpt below which foretold whipsaw action which is precisely what Wall Street delivered with three large swings.
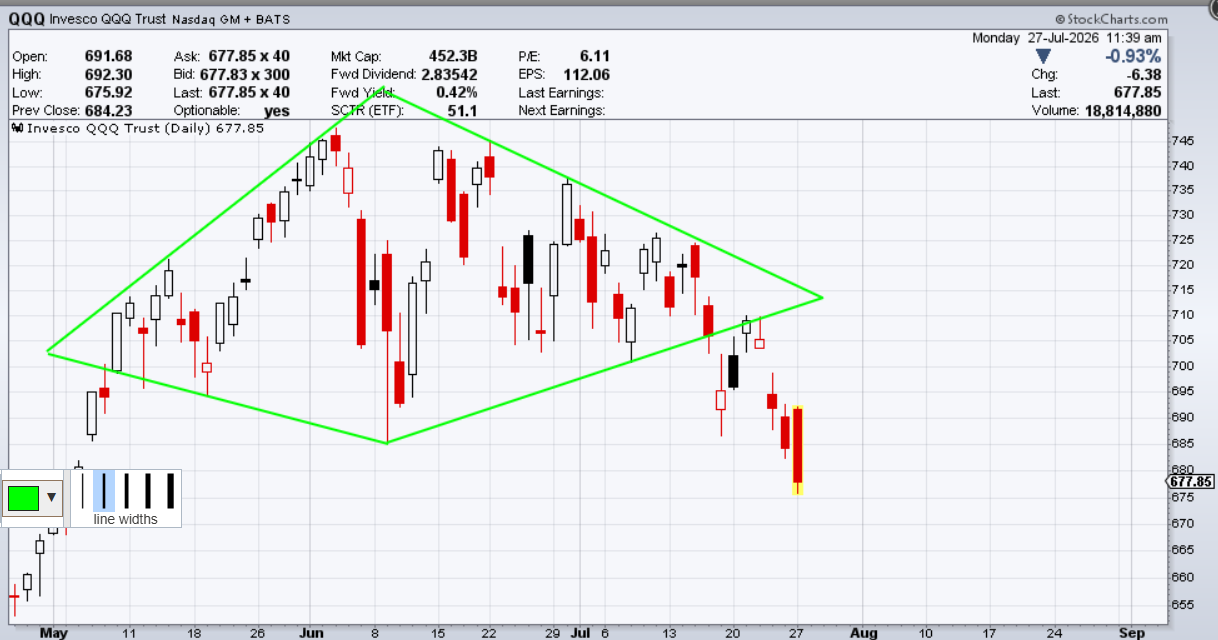
The developing QQQ diamond pattern which I noted several weeks ago did as expected and tested the break of the lower right trend line and is now accelerating away to the downside.
And finally, the Fed conflab is slap bang in the middle of the peak in the turn window this week. The will he or won't he question is hanging over Kevin, that is, will he fight inflation or won't he jump on Jerome's transitory train for at least a few stops on the tracks to nowhere. My money's not on dove or hawk. I'm betting on chicken - talking tough, squawking and flapping his wings a lot, but in the end just sitting there laying an egg, actually doing nothing substantial on the inflation front except to feed it by continuing to enable the printing of funny money like there is no tomorrow to satiate the Treasury's never ending need for debt.
Regards,
Douglas
145 Views ·
0 Replies
- 941,660 Total Posts
- 3,188 Total Members
- Michael Lu Newest Member
- 64,537 Most Online
12253 users are online (in the past 60 minutes)
1 members, 12251 guests, 1 anonymous users (See full list)
Google, Bing, Smithy

