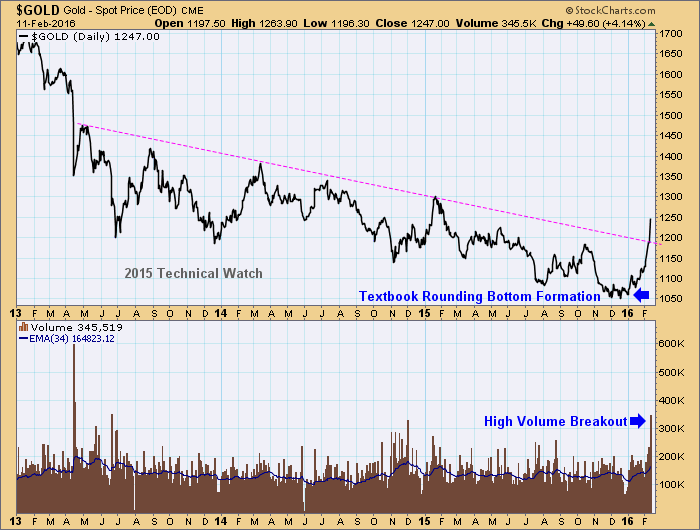
Showing the importance of today's $50.00 move in the price of gold on a longer term basis.
The next technical expectation is for a snapback to or towards the breakout line seen on the chart.
Fib

Member
Posted 11 February 2016 - 05:55 PM
Showing the importance of today's $50.00 move in the price of gold on a longer term basis.
The next technical expectation is for a snapback to or towards the breakout line seen on the chart.
Fib
Better to ignore me than abhor me.
“Wise men don't need advice. Fools won't take it” - Benjamin Franklin
"Beware of false knowledge; it is more dangerous than ignorance" - George Bernard Shaw
Demagogue: A leader who makes use of popular prejudices, false claims and promises in order to gain power.
Technical Watch Subscriptions
Member

Posted 11 February 2016 - 10:00 PM
The real breakout is up around $1400, as shown here by Armstrong....

Member

Posted 12 February 2016 - 01:48 AM


TTHQ Directory →
Fearless Forecasters →
Market UpdateStarted by fib_1618 , 15 Feb 2024 |
|

|
||
TTHQ Directory →
Market Analysis Area →
Weekly Breadth Data - 1/19/24Started by fib_1618 , 28 Jan 2024 |
|
|
||
TTHQ Directory →
Market Analysis Area →
Weekly Breadth Data - 11/24/23Started by fib_1618 , 29 Nov 2023 |
|
|
||
TTHQ Directory →
Market Analysis Area →
Weekly Breadth Data - 12/30/22Started by fib_1618 , 03 Jan 2023 |
|
|
||
TTHQ Directory →
Market Analysis Area →
Weekly Breadth Data - 12/9/22Started by fib_1618 , 15 Dec 2022 |
|
|

