It is with great hope that the reader has benefited from these delayed weekly reviews during this first full year under bear market conditions. This post will serve as the last one for this cycle. I would like to thank Mark for allowing these educational cross posts for all of his Traders-Talk members.To receive the Weekly Breadth Data analysis in a more timely manner, along with the more intimate and timely chat sessions where we dig a bit deeper into the rhythm of breadth dynamics, is by subscribing. Use the subscription link provided at the bottom of this page for more information. Remember...your subscription is month to month, so if you find this wide ranging amount of data and/or the analysis it provides isn't for you to help keep you on point of the short and intermediate term directional trend, you can cancel at any time. That said, you probably won't find a better complimentary tool to your own trading style in your personal effort toward capital appreciation, and above all else, capital preservation itself.
Thank you for your kind consideration, and I wish you all the very best in your future trades.
***********************
Outside of a quick dip on Wednesday where the NASDAQ Composite Index closed at its lowest levels since July of 2020, the major market indices finished the holiday shortened week on Friday nearly unchanged with an average loss of -.19%. For the month of December itself, equity market indexes came away with an average loss of -5.87% which was led by the NASDAQ Composite's haircut of -8.73%. For the fourth quarter of 2022, there was still a respectable average gain +8.86%, but this was again dragged down by the NASDAQ Composite's quarterly loss of -1.03%. So as we close out the first full year under bear market conditions, the major market indices finished with an average loss of -17.46% with the Dow Industrials keeping the hope of a bull market alive with a loss of only -8.78%, the NASDAQ Composite losing a third of its value with a loss of -33.10%, and the S&P 600 Small Cap Index finishing right on the average at -17.42%. It should also be duly noted that the average loss in 2022 was the worse traders and investors have seen since 2008 where the average loss for that year was a resounding -37.17%!
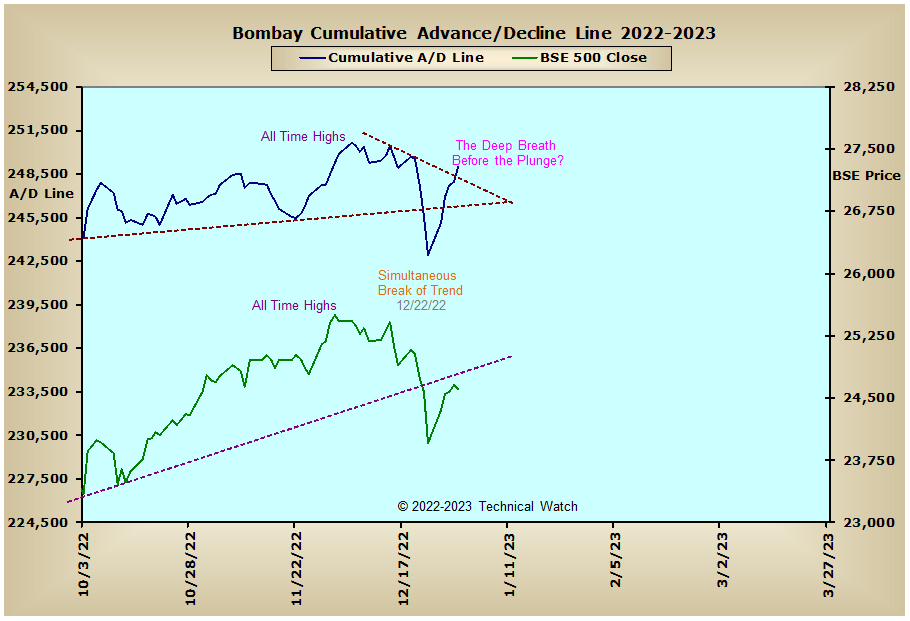
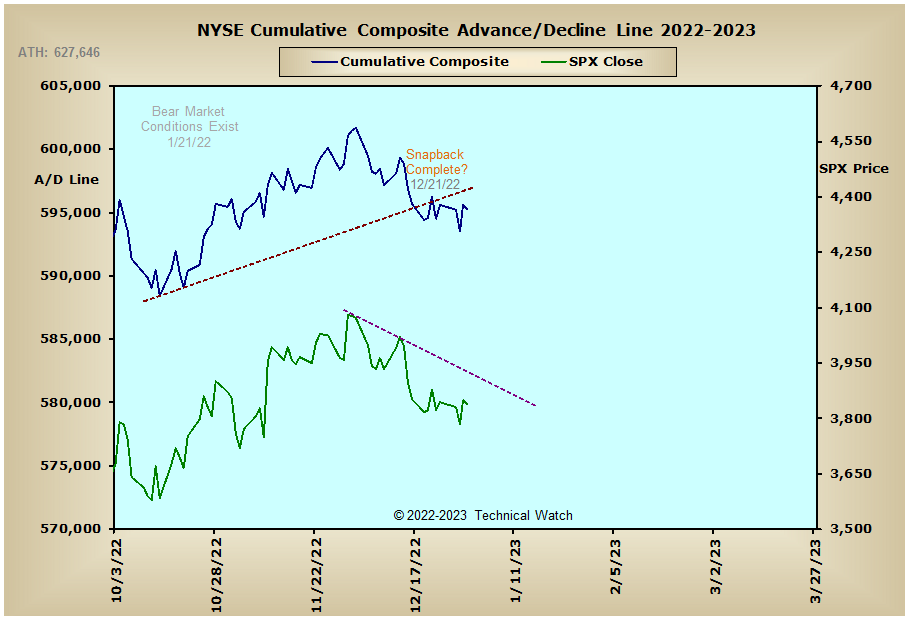
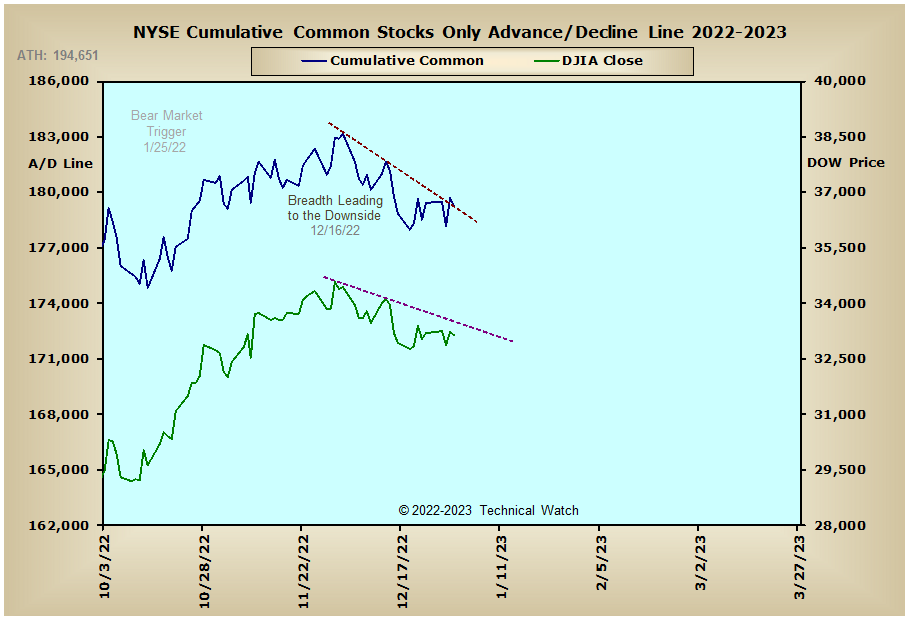
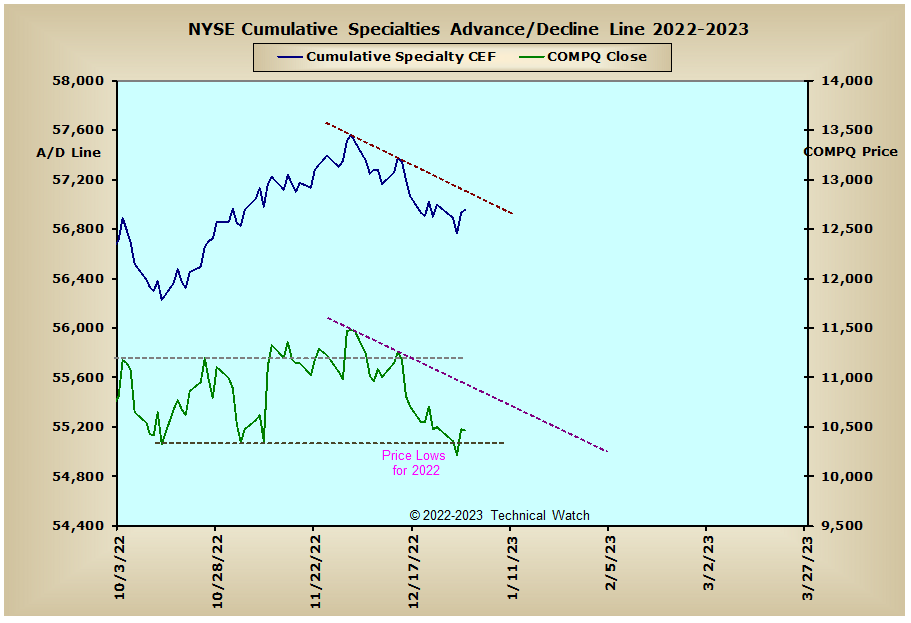
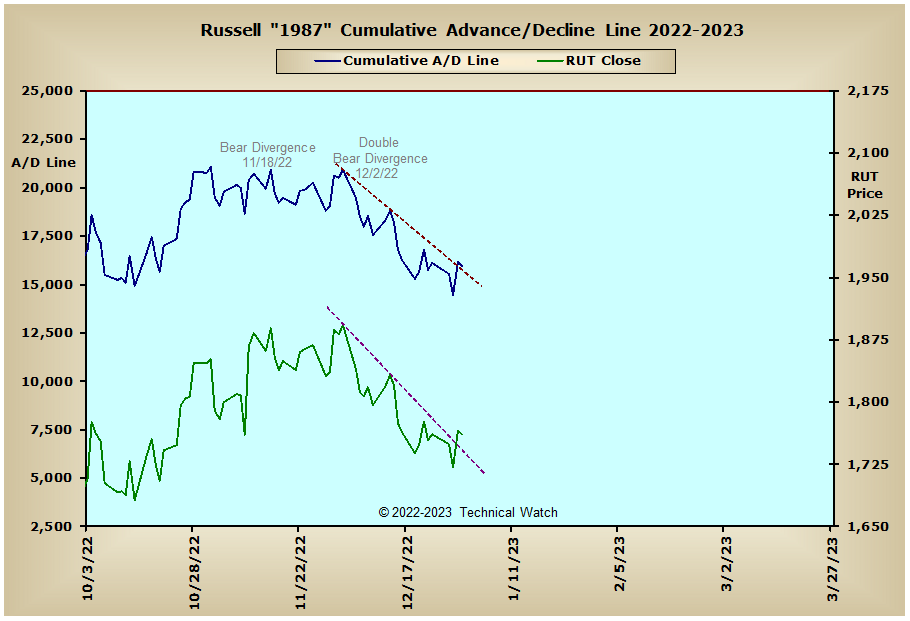
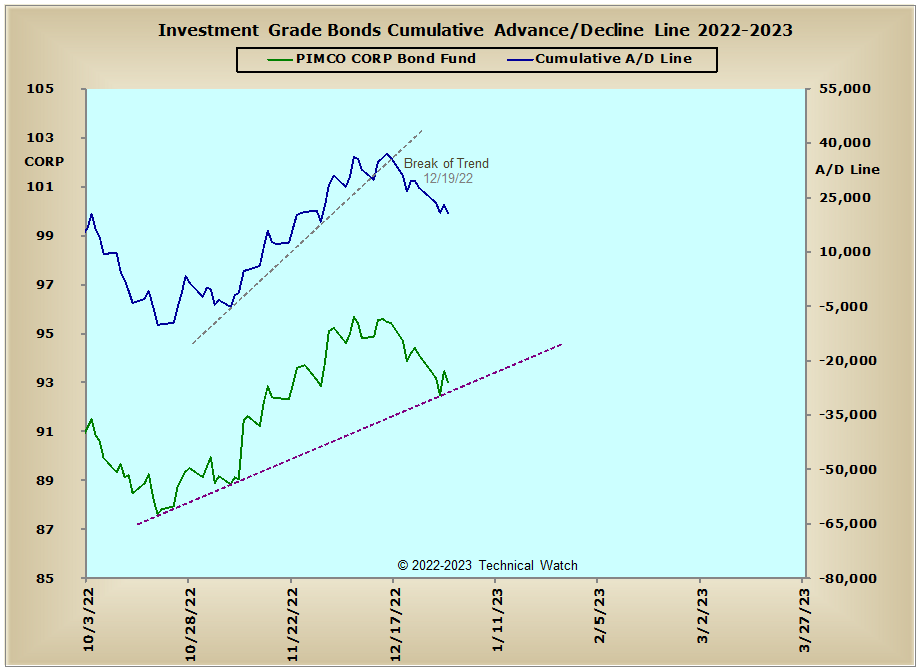
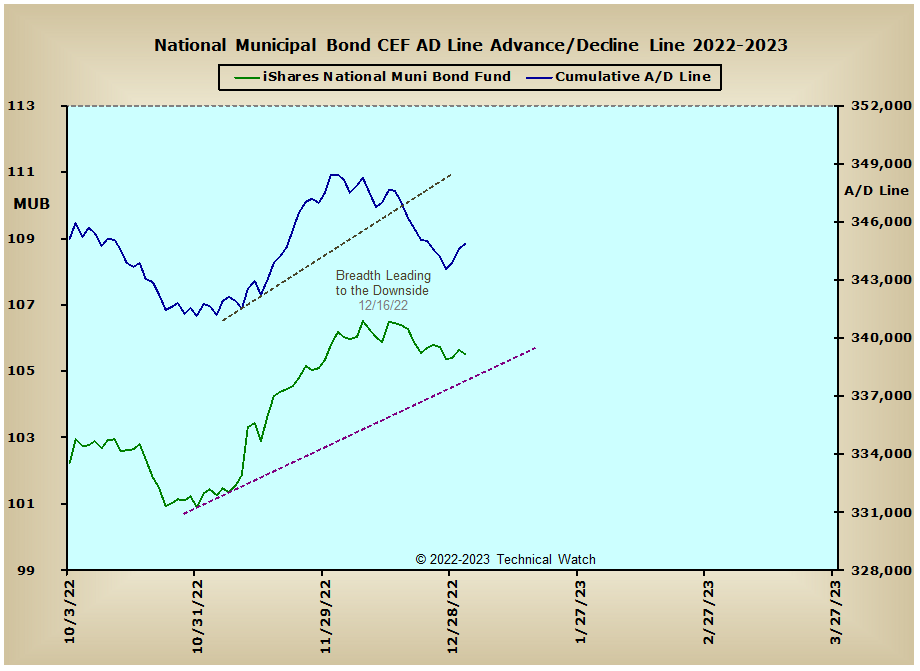
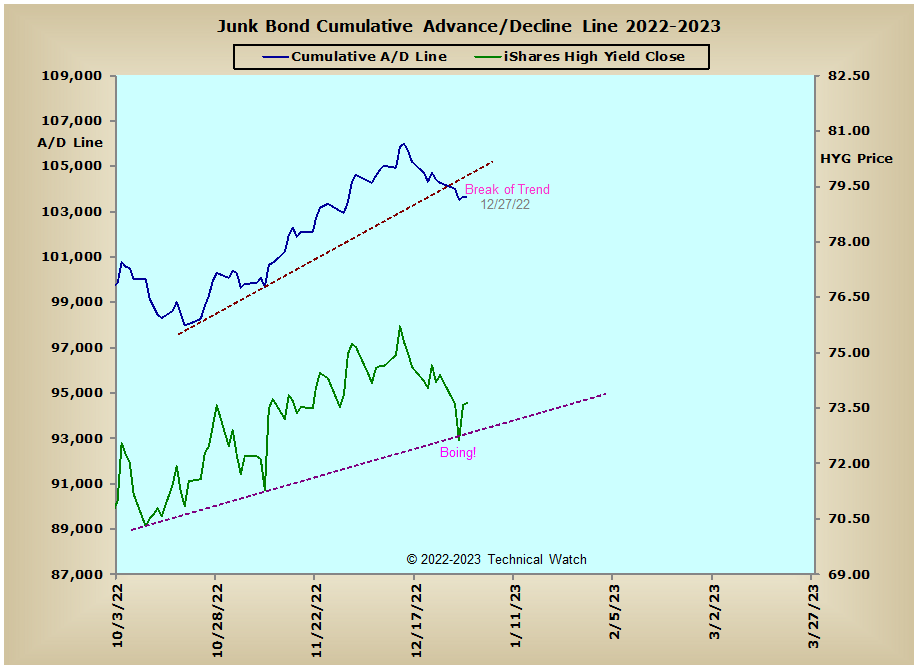
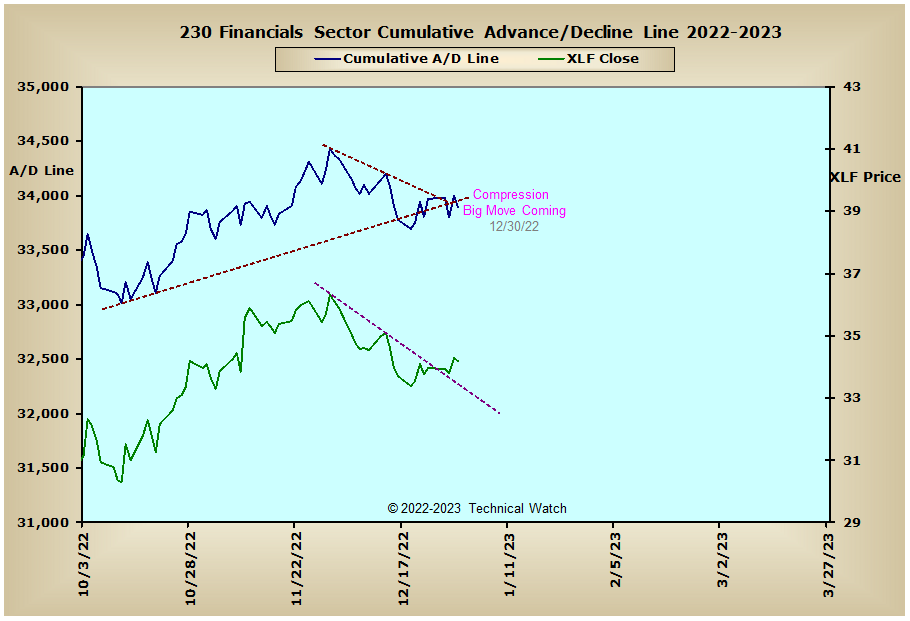
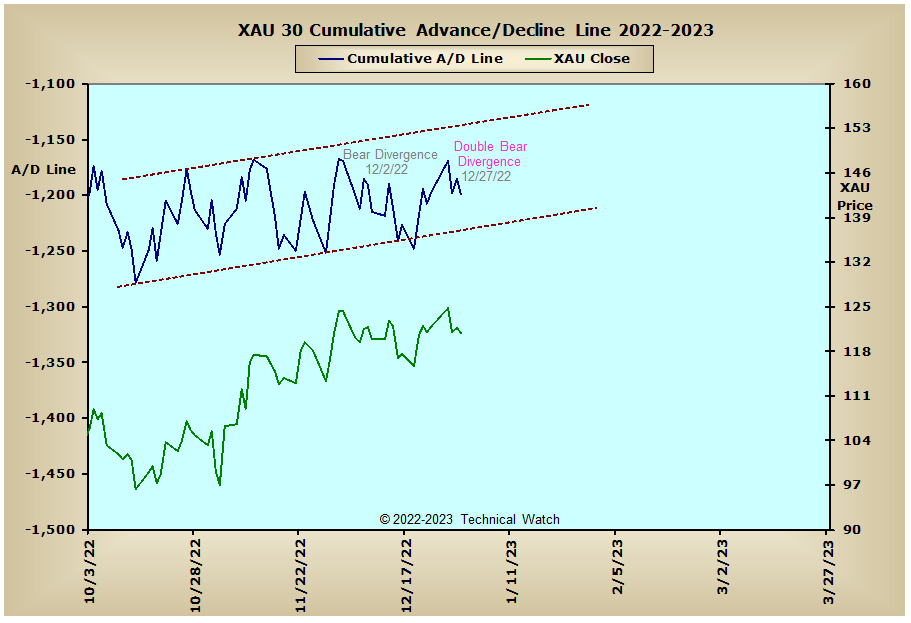
Since both price and breadth pretty much moved net sideways for the week, and outside of newly formed breadth to price bearish divergences with the precious metals asset class, there isn't too much analytically to add on a narrative basis to that of last week's review, so we'll let the charts and their annotations speak for themselves as we close out the year.
Have a great trading week!
US Interest Rates:
US Sectors: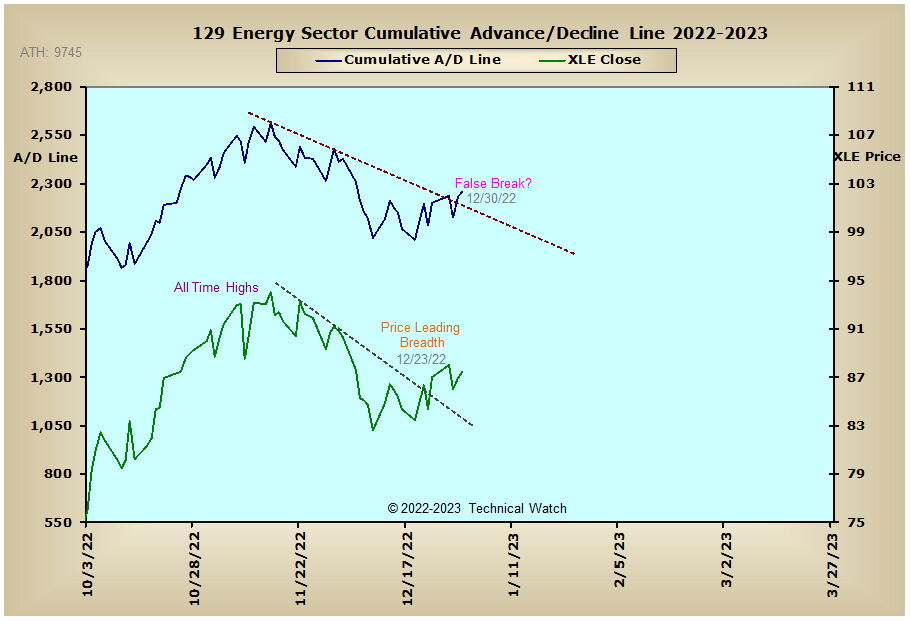

Precious Metals: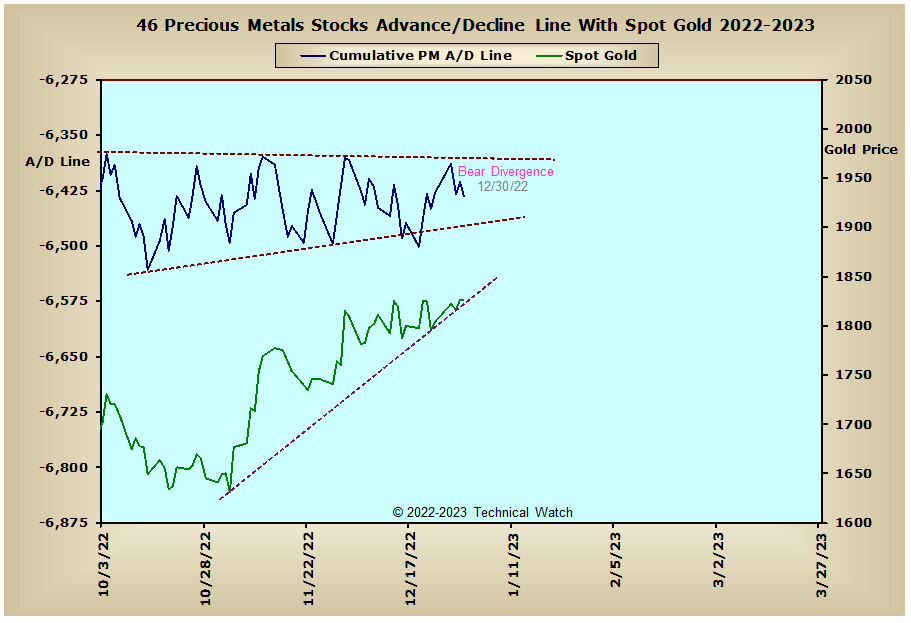
Australia: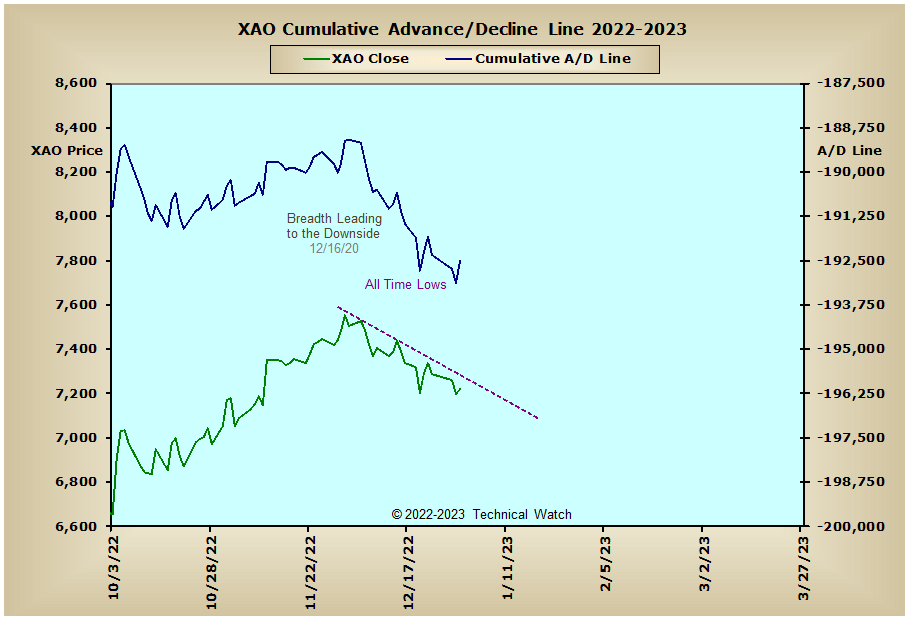
England: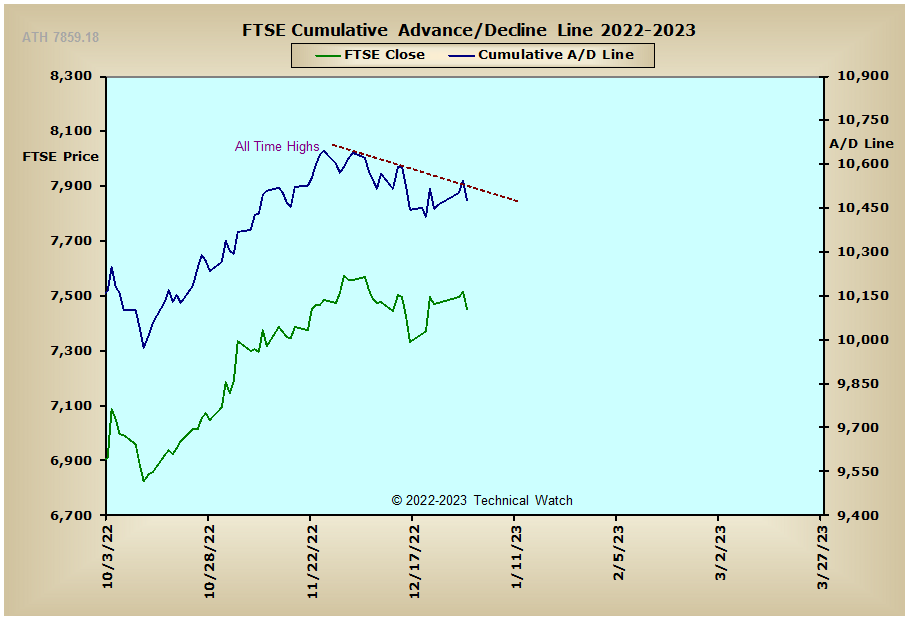
France:
Germany:
India: