This will be the last freebie for this cycle. I hope the reader has benefited from these weekly reviews during this correctional market sequence. To receive the Weekly Breadth Data analysis in a more timely manner is by subscribing. Use the subscription link provided below for more information. Remember...your subscription is month to month, so if you find breadth dynamics and/or my analysis isn't for you, you can cancel at any time. Thank you in advance for your kind consideration.
Partial Quote from the Previous Week:
But as we know all too well from past experience, as long as the breadth and volume MCSUM's remain above their important +500 escape velocity levels, it will continue to be difficult for the sellers to mount up any kind of negative action in their favor.
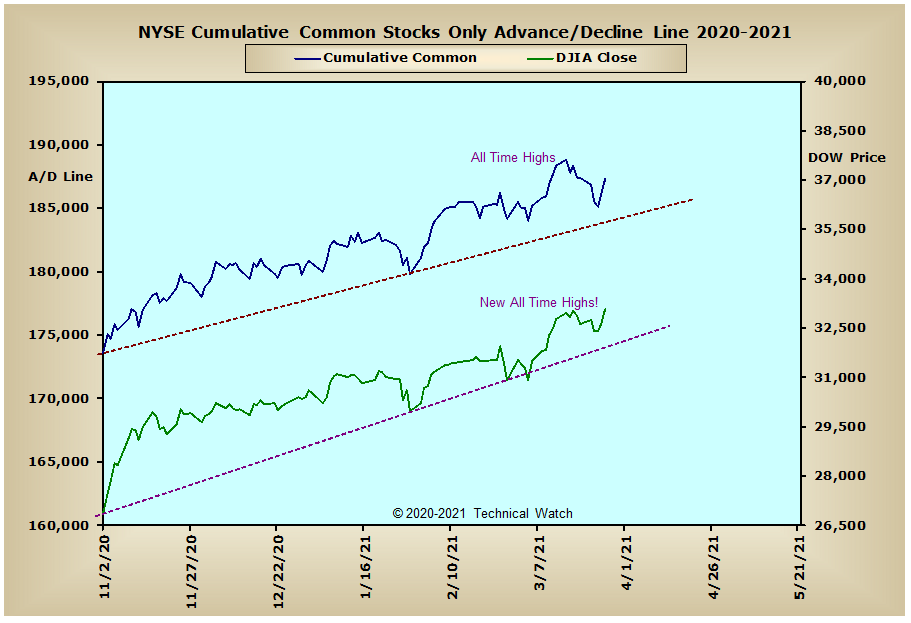
After a mixed start on Monday, and then weakness into Wednesday, the major market indices pivoted higher on Thursday to finish the week with a small average gain of +.31%. Leading the way higher were the large cap issues as the Dow Industrials and S&P 500 closed out on Friday at new all time record highs, while the other major indices continue to track the month of March in new all time high territory on a monthly basis.
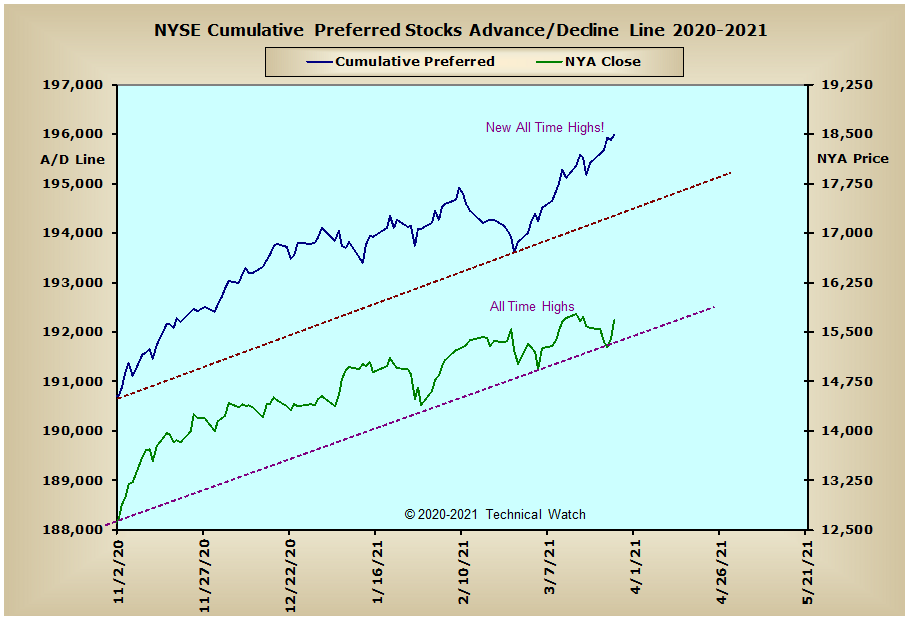
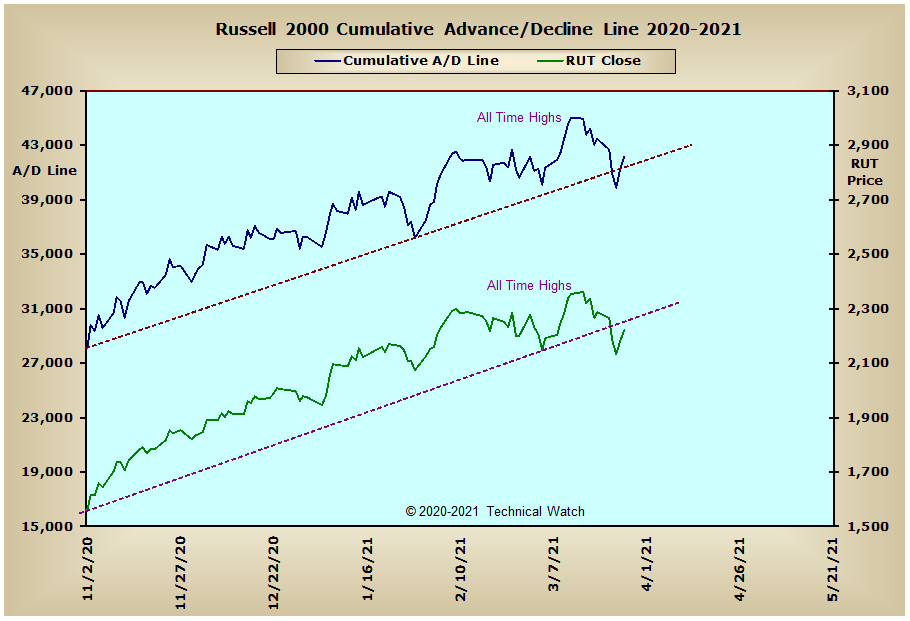
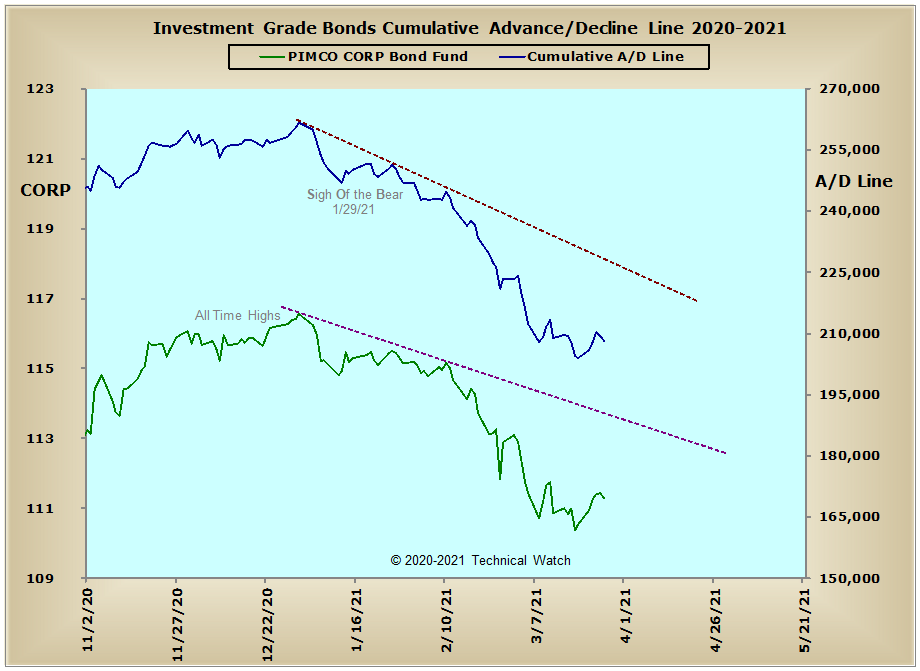
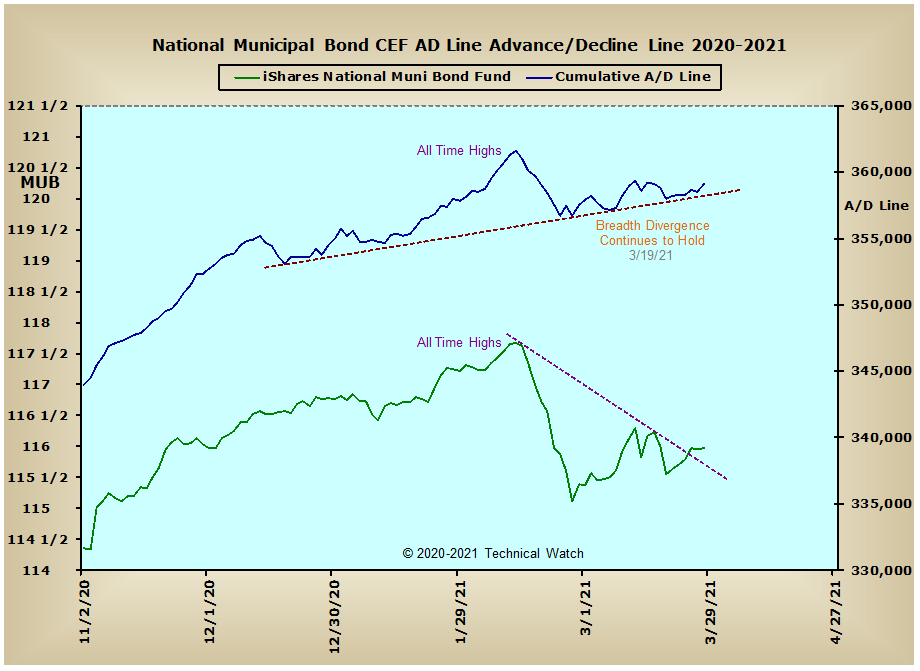
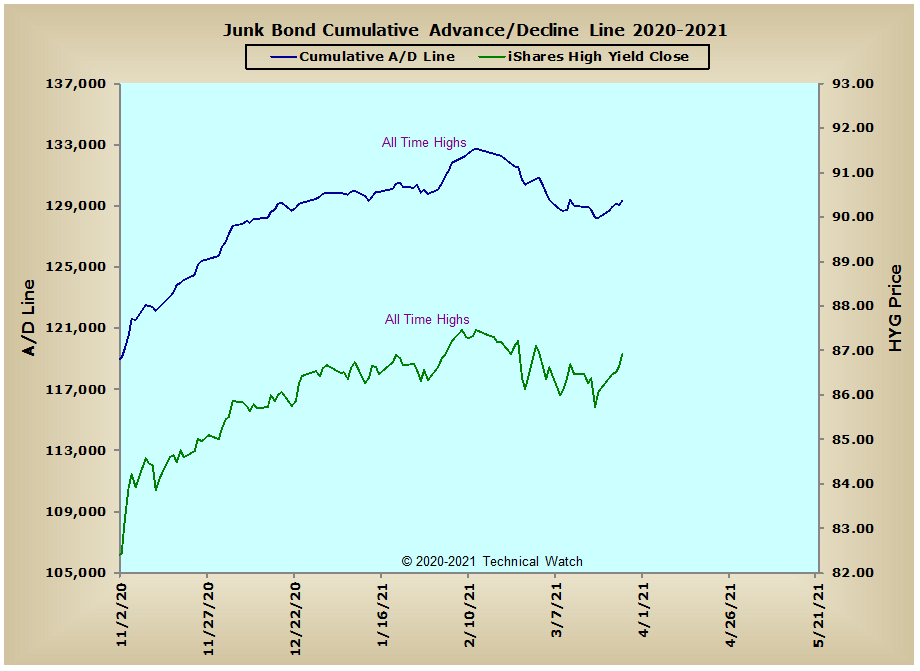
Taking a cursory view of our usual array of cumulative breadth charts shows that most found support on their intermediate term rising bottoms lines during last week's pullback with the NYSE Preferred Stock advance/decline line actually closing on Friday at new all time highs. With the NYSE Bond CEF and Municipal Bond advance/decline lines continuing to find buoyant support over the last several weeks, this is good news for the equity market bulls as we go into the month of April in spite of a rising yield curve. Additionally, it also looks like the selling in the Investment Grade advance/decline line is beginning to wane as it was able to rise above a previous top for the first time last week since the S.O.B. trigger on January 29th. With the Junk Bond advance/decline line also holding steady, all of this does suggest that the debt asset bears are running out of fuel, and with it, interest rates on the 10 year note will likely find strong resistance at its 200 week EMA at the 1.70% level from where a decline of 1/2% is likely over the coming weeks ahead.
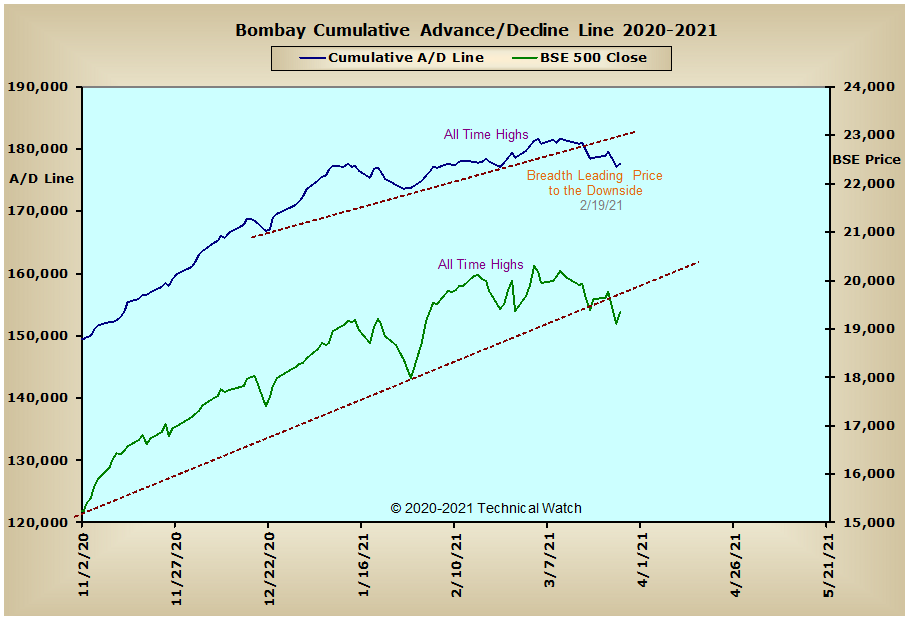
Looking across the pond and we see that the CAC, DAX and FTSE advance/decline lines continue to show cumulative patterns of rising bottoms with all three within striking distance of their all time highs. Prices in Australia's Old Ordinaries Index also continue to "magically" trend higher in spite of the Aussie advance/decline line trending lower...as if it's looking forward to an upcoming bottom in the precious metals asset class. Our only global negative comes with the Bombay advance/decline line which broke its intermediate term trendline of support on March 19th and now prices in the BSE 500 are beginning to follow to the downside. This weakness in the emerging markets sector might be better related to rising global rates, but if we are nearing a top there, we might look back on this as only a well deserved rest in the longer term uptrend. Stay tuned.
So with the BETS losing ground this past week to a reading of +55, the equity markets still remain friendly toward traders and investors. Current internals are mixed overall with the short term trend of breadth firming toward neutral on Friday, while the short term trend of volume remains lethargic. Good news for the longer term is found with the NYSE TRIN which closed on Friday with a reading of 2.11. As we know from past experience, readings above 2.00 tend to mark important intermediate term bottoms in stock prices within a couple of weeks. With the NYSE Open 10 TRIN also closing on Friday in deeply "oversold" territory with a reading of 1.31, the week ahead will likely have a bias toward the buyers. Also mentioned by one of my colleagues, Randy Nelson, put option orders last week were at their highest levels since the early November price lows. Taken together then, let's go ahead and again walk the bullish path of least resistance for the week ahead, while remaining "stop disciplined" on any open long positions until we get a better underlying rhythm to work with.
Have a great trading week!
US Equity Markets: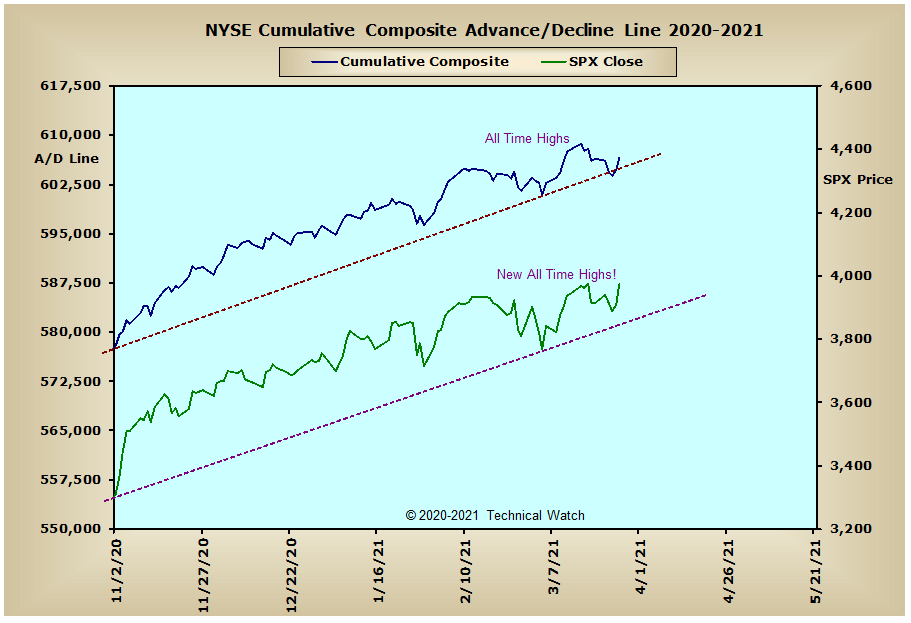
US Interest Rates: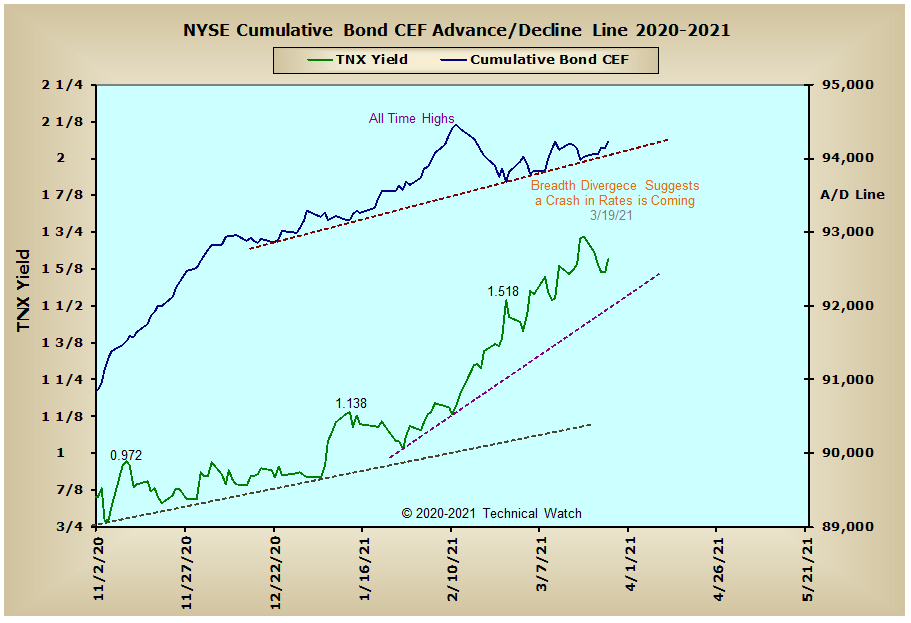
US Sectors:
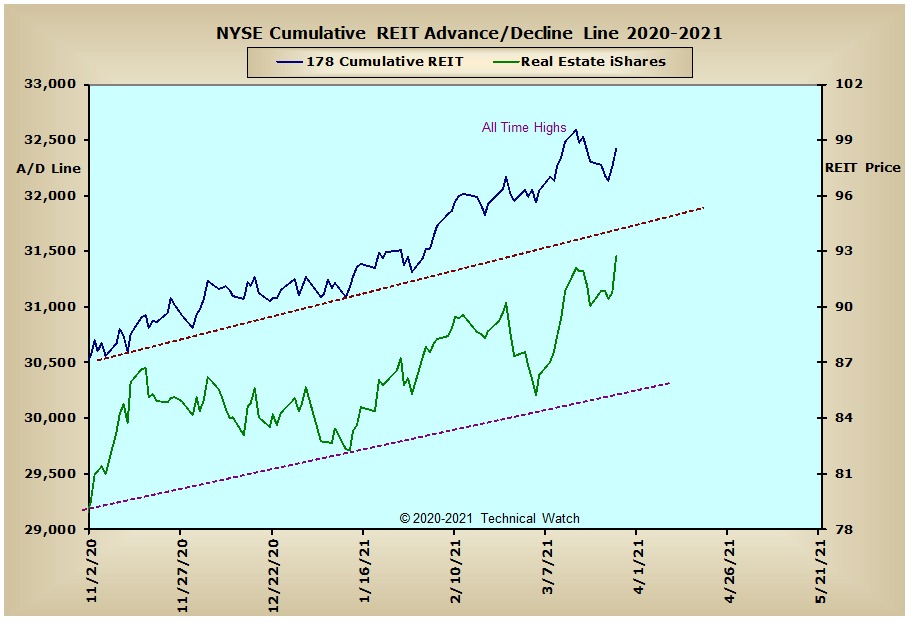
Precious Metals: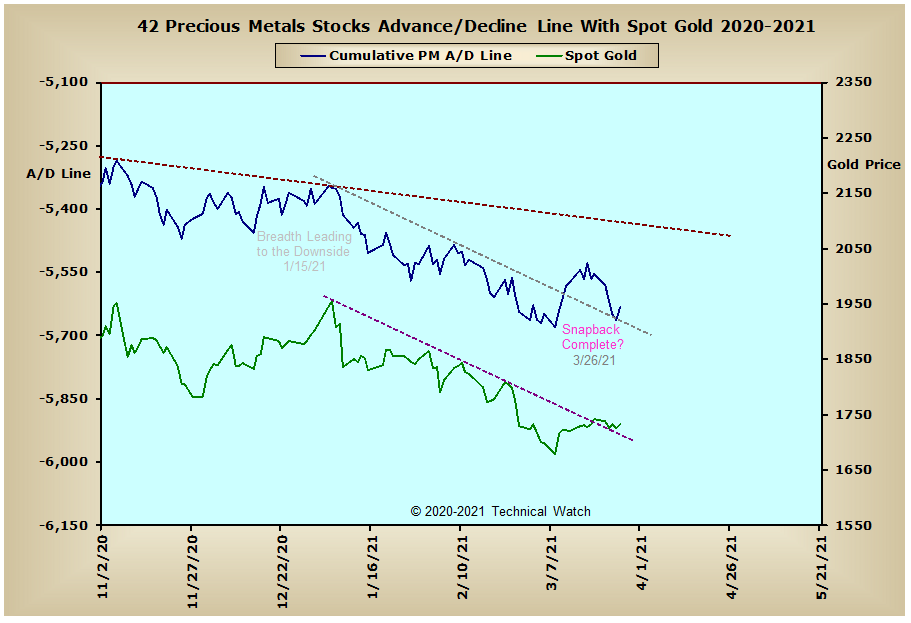

Australia: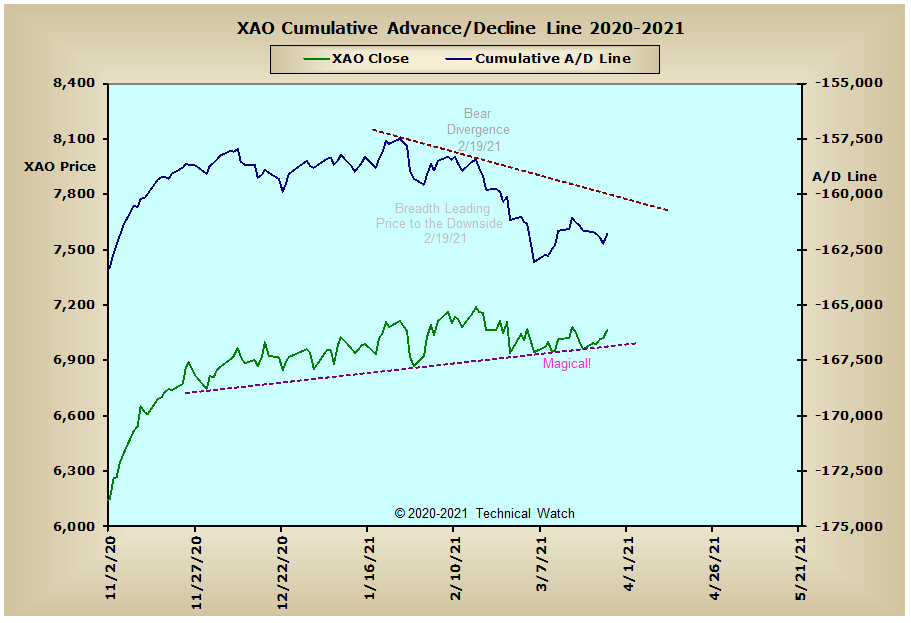
England:
France: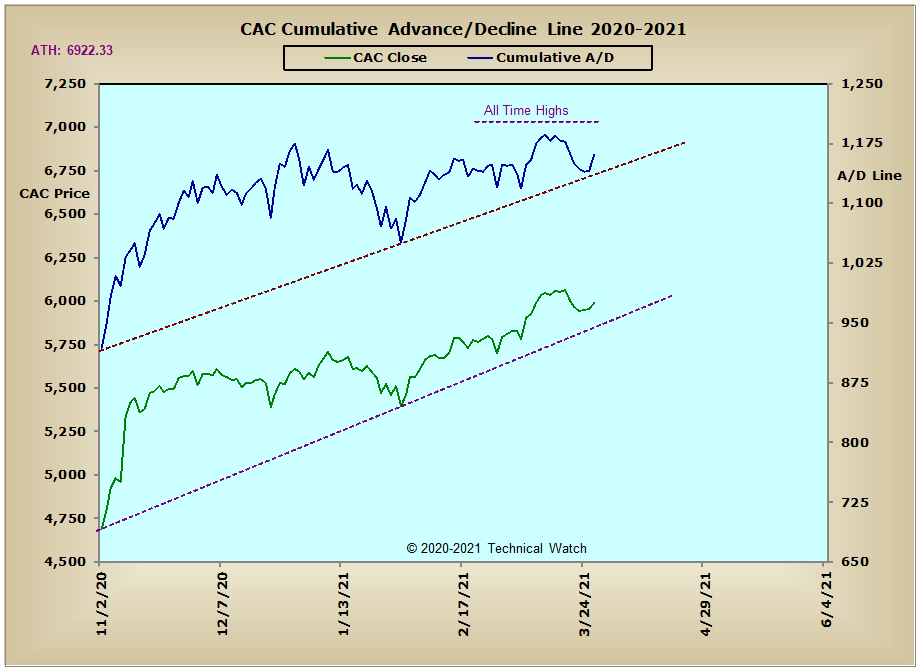
Germany: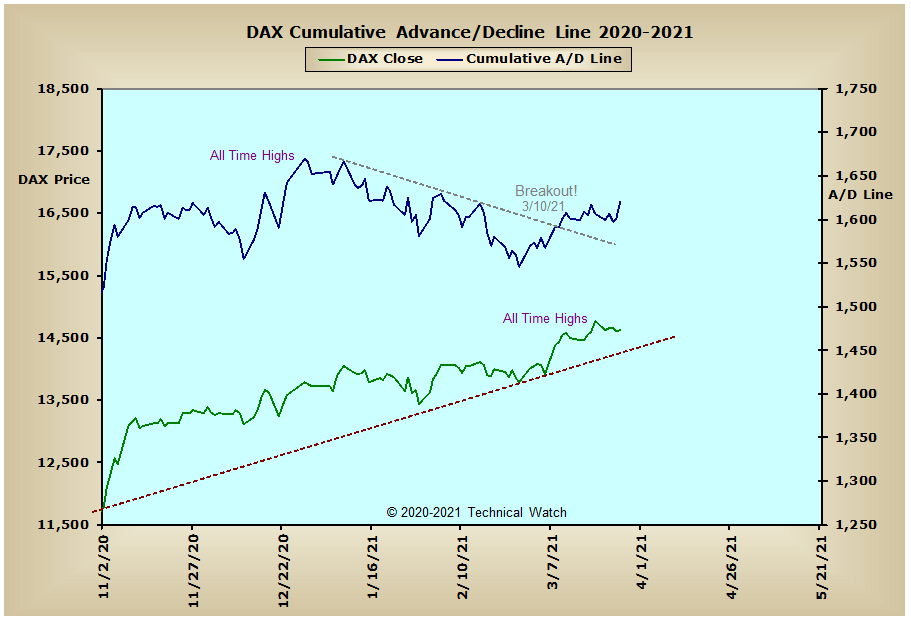
India: