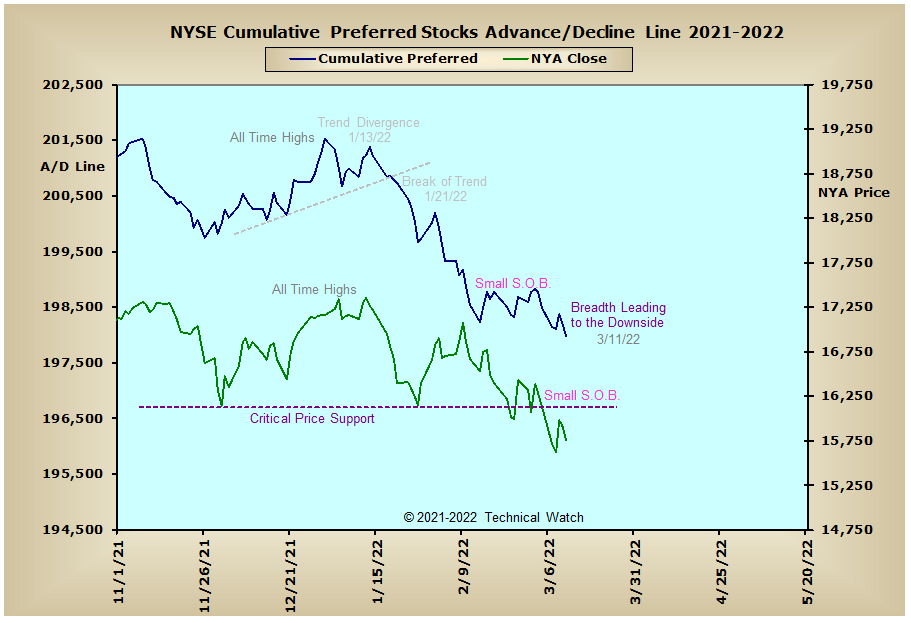
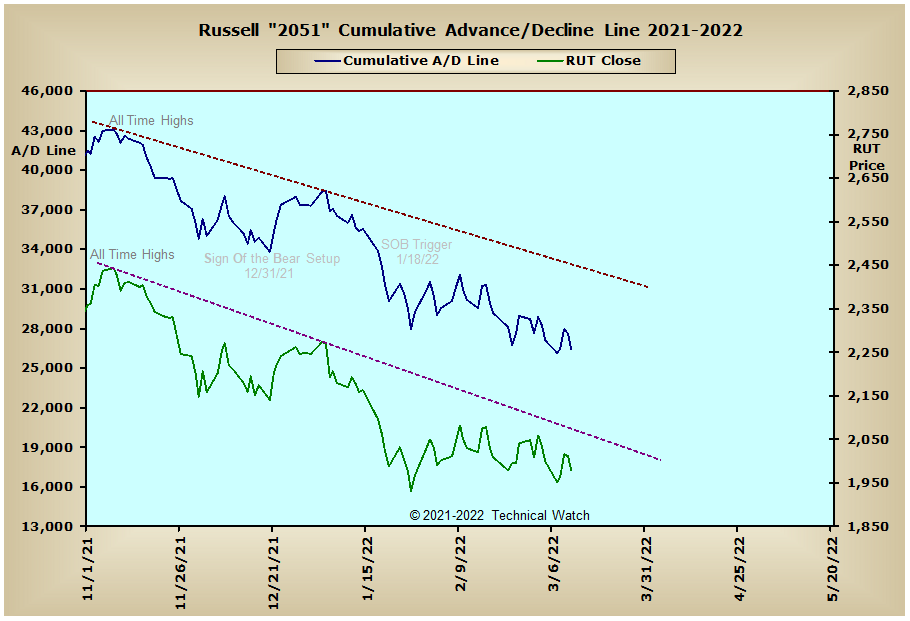
After several index price charts broke below their longer term trading range floors early in the week, the major market indices then consolidated below these important levels of longer term horizontal support to finish on Friday with an average loss of -2.26% as these same component averages now find themselves just below their 50 week EMA's.
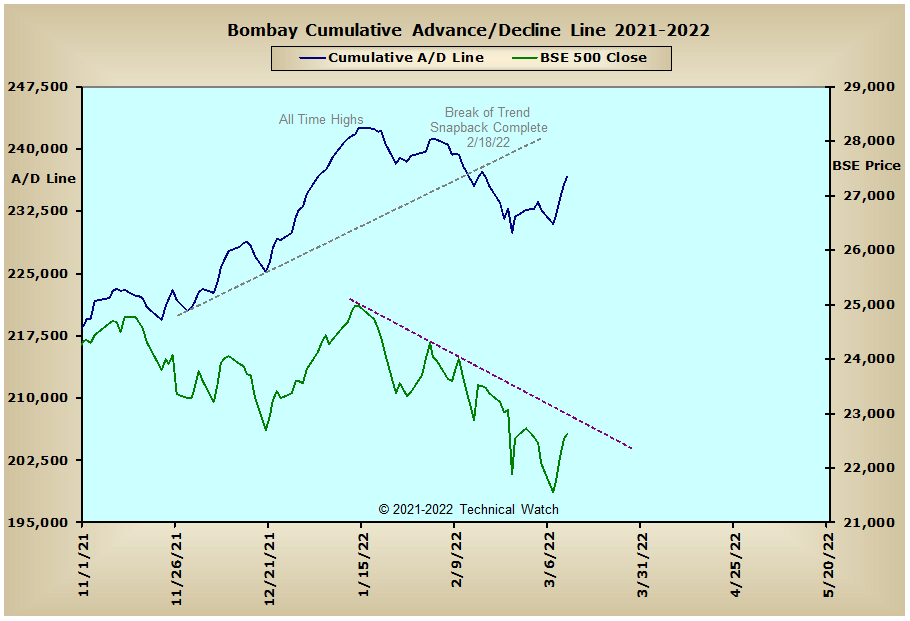
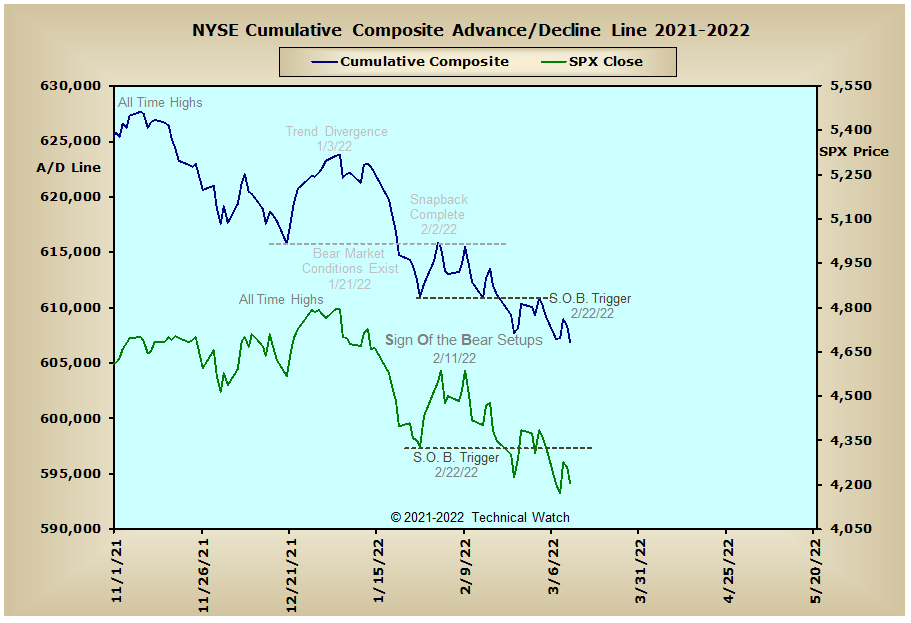
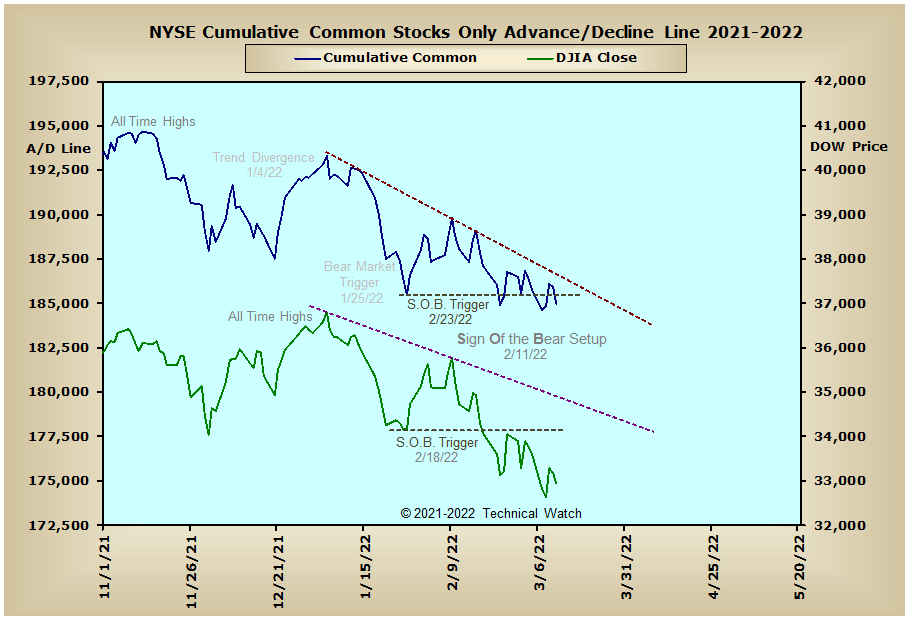
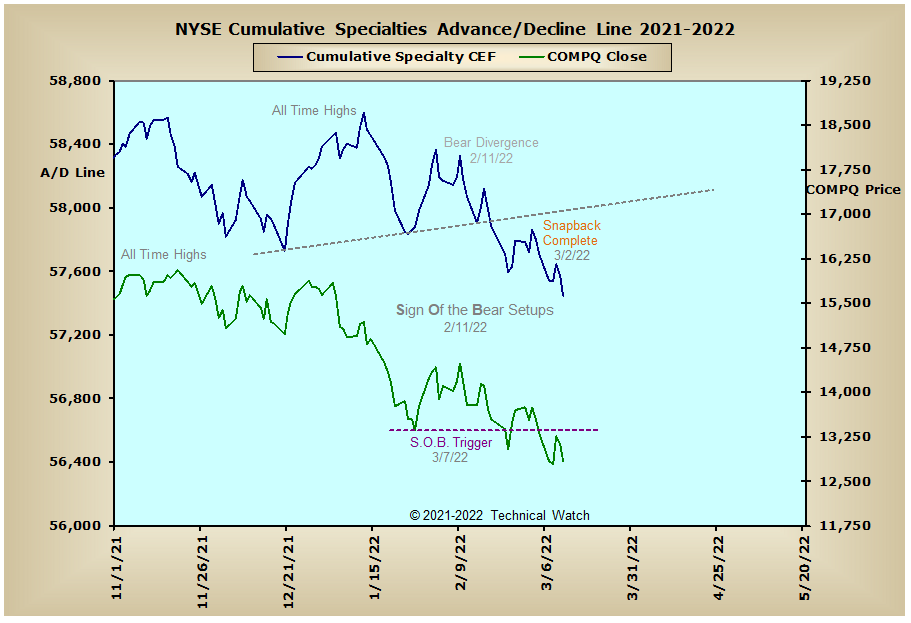
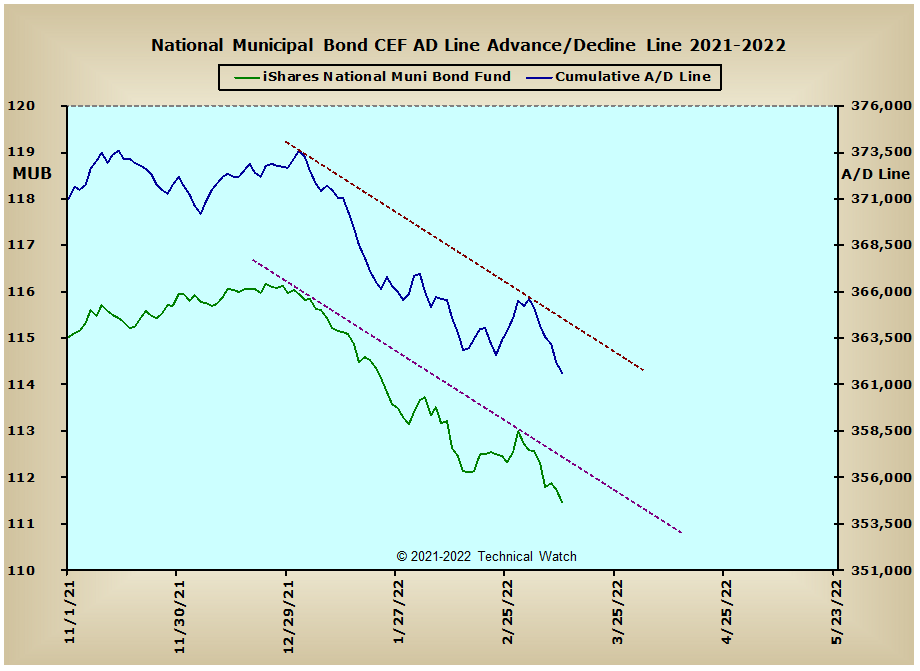
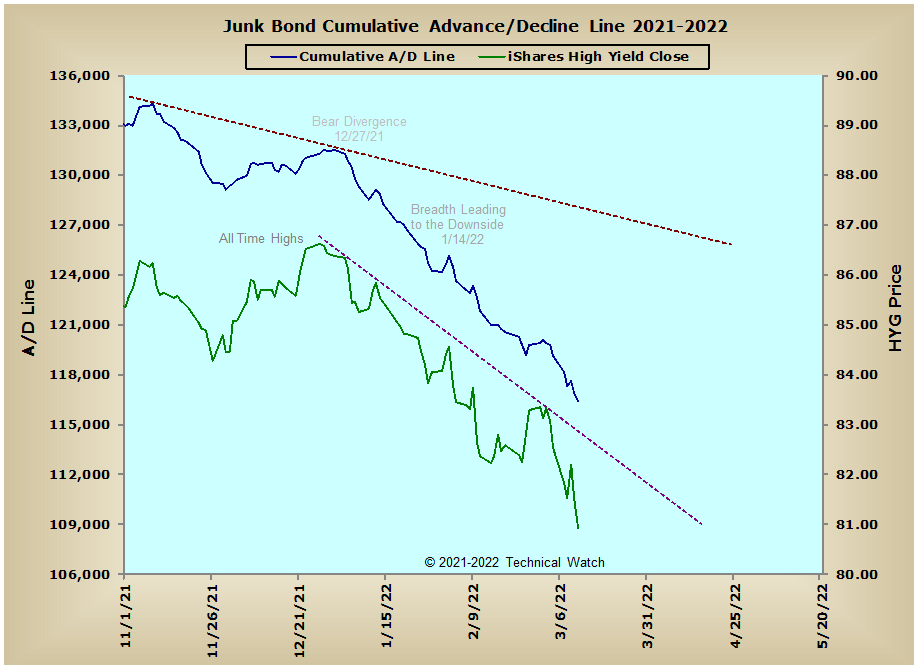
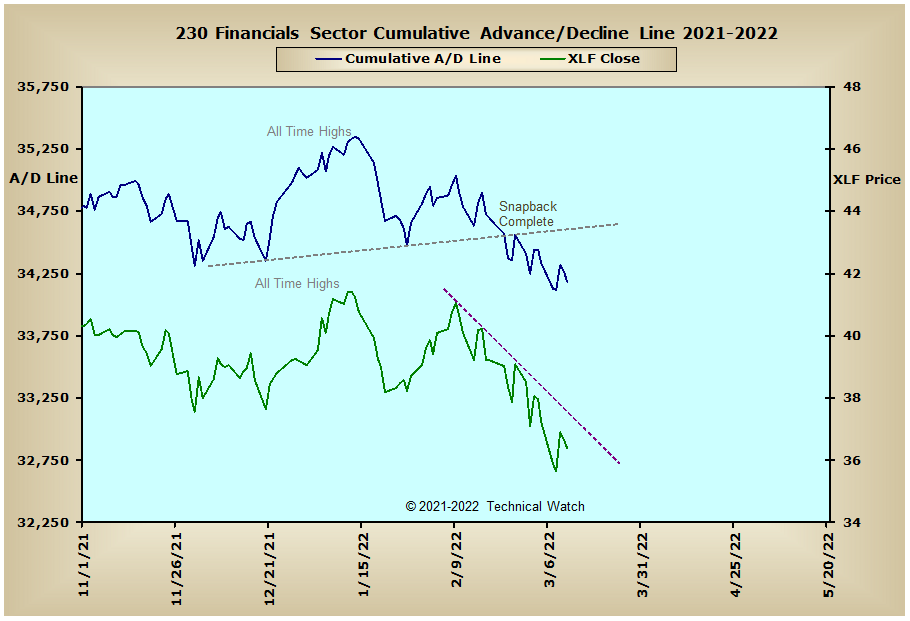
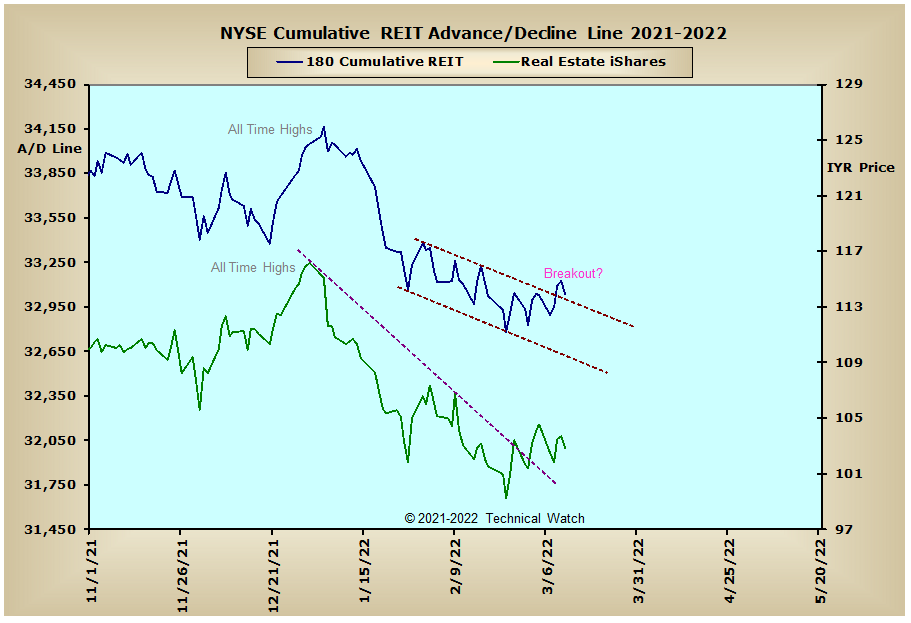
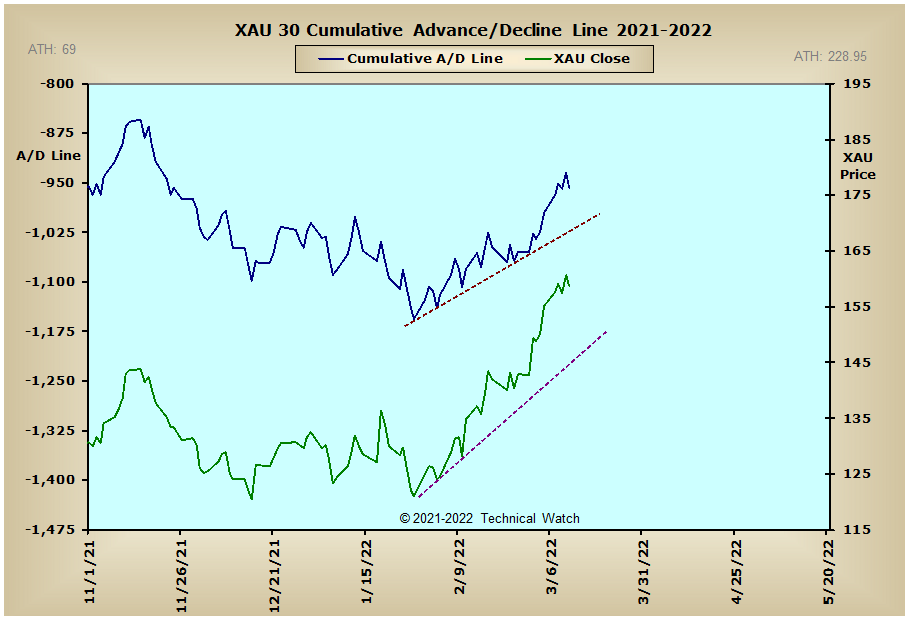
Looking over this week's edition of cumulative breadth charts shows that the NYSE related advance/decline lines continue to move along the path of least resistance to the downside. Of special note are the interest rate sensitive areas of the marketplace which continue to move with authority to the downside as the price of energy, agriculture and earth commodities continue to skyrocket with their promise of future inflationary expectations. Precious metals finished mixed for the week as the price of gold came within $26 of its all time highs on Tuesday before selling off sharply the following day. However, the good news for the precious metals asset class is that the broader based Precious Metals McClellan Summation Index (not shown) was able to move above its highs of last November on Friday. This now clears the way for the price of gold to move into new all time high territory in the days and weeks ahead even without the internal support of its longer term advance/decline line. Not surprisingly, European markets remained defensive last week as hostilities in the east continue to have their thumb on the bearish scale.
So with the BETS moving up to a reading of -20, traders and investors start the week ahead with a more neutral trading strategy as 1st quarter expirations of futures and options come on Friday. All of the breadth and volume McClellan Oscillators begin the week in negative territory with the exception of the MID and SML volume MCO's. The weakest link at this time is with the issues that make up the NASDAQ 100 index as its breadth and volume MCO's broke below their reaction lows of March 7th on Friday. The 10 day average of put/call ratios remains nearly unchanged from last week as we go into Friday's OPEX period, while the Open 10 TRIN's continue choppy up and around their neutral mark. With the Wall Street Sentiment Survey once again showing a strong bearish bias with 15% bulls and 54% bears, the week ahead is likely to continue to be erratic, if not volatile, with an overall bearish tone. Using all this as a backdrop then, let's look for prices to continue moving net sideways for much of the week ahead, with any triggers of the daily Parabolic SAR's in the Dow, SPX, COMPX and SML as our signal to move back to a more aggressive bearish stance.
Have a great trading week!
US Interest Rates: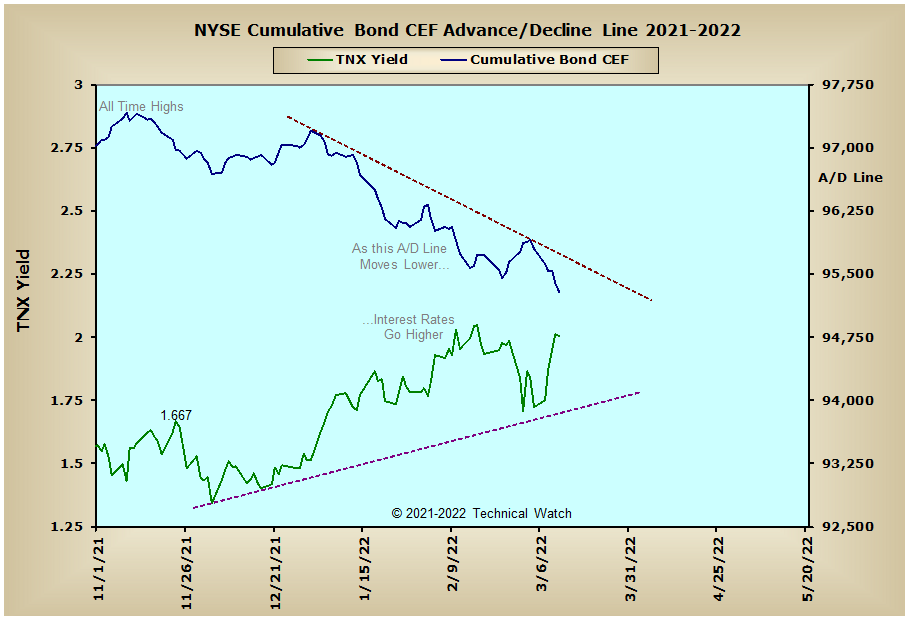
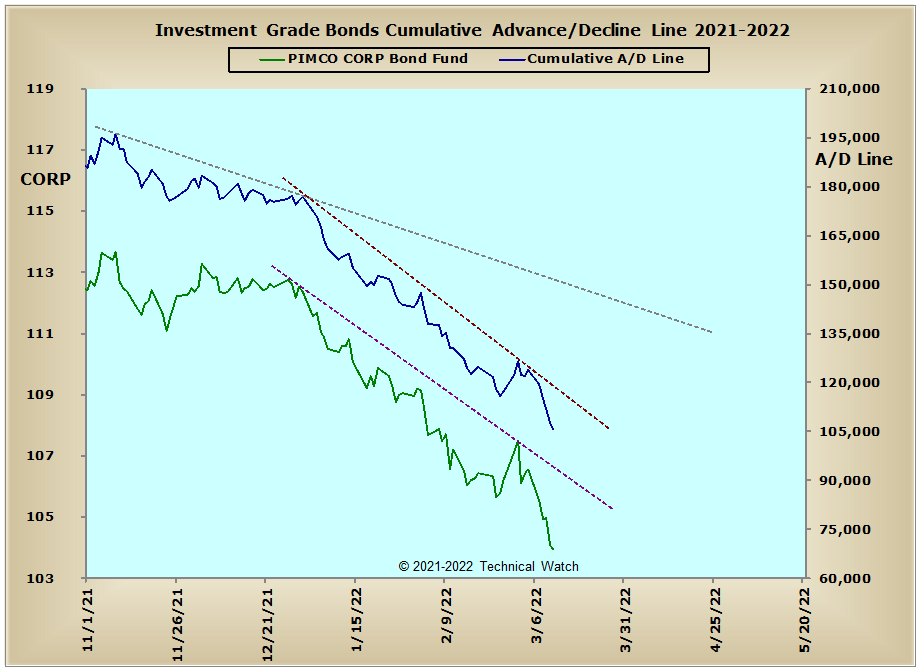
US Sectors: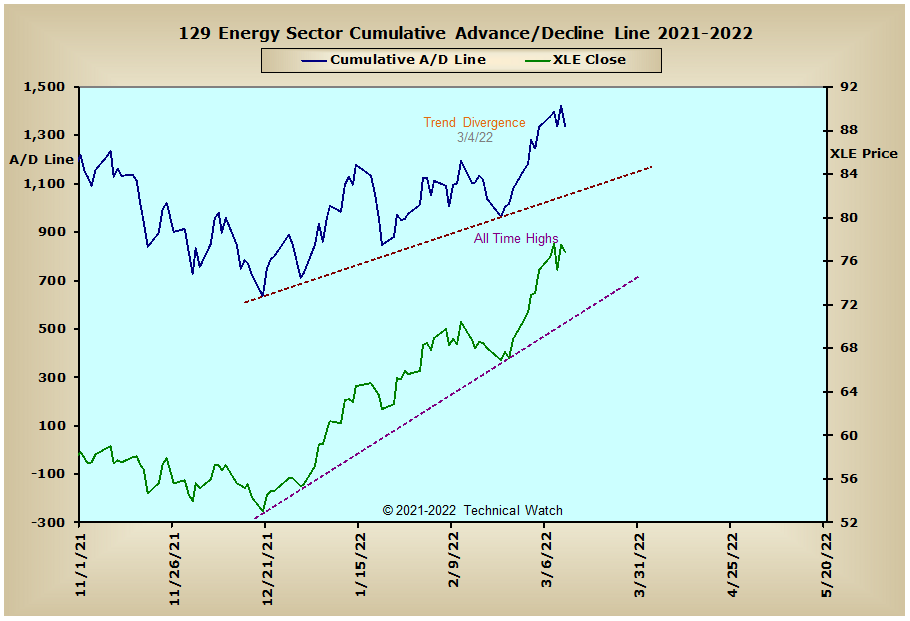
Precious Metals: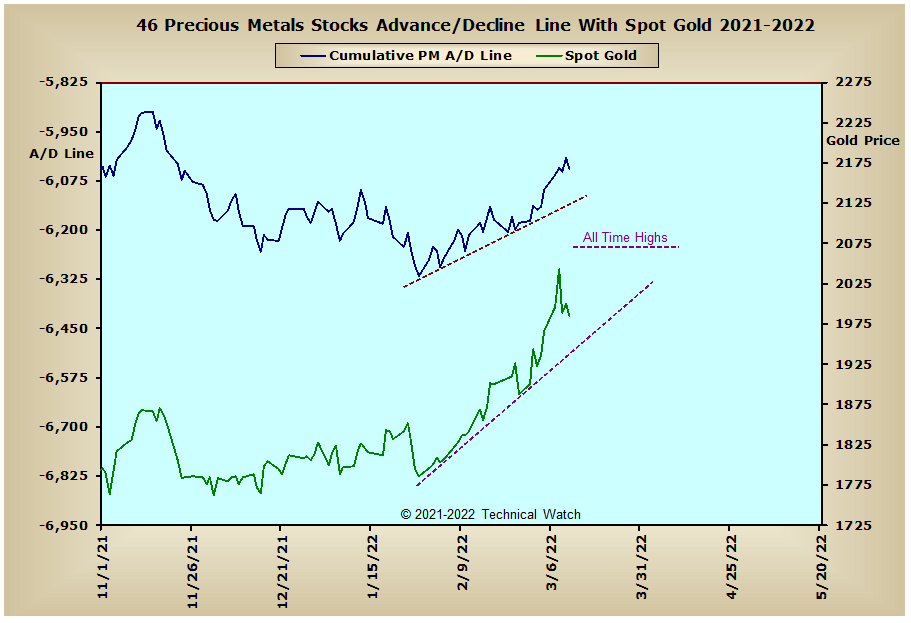
Australia: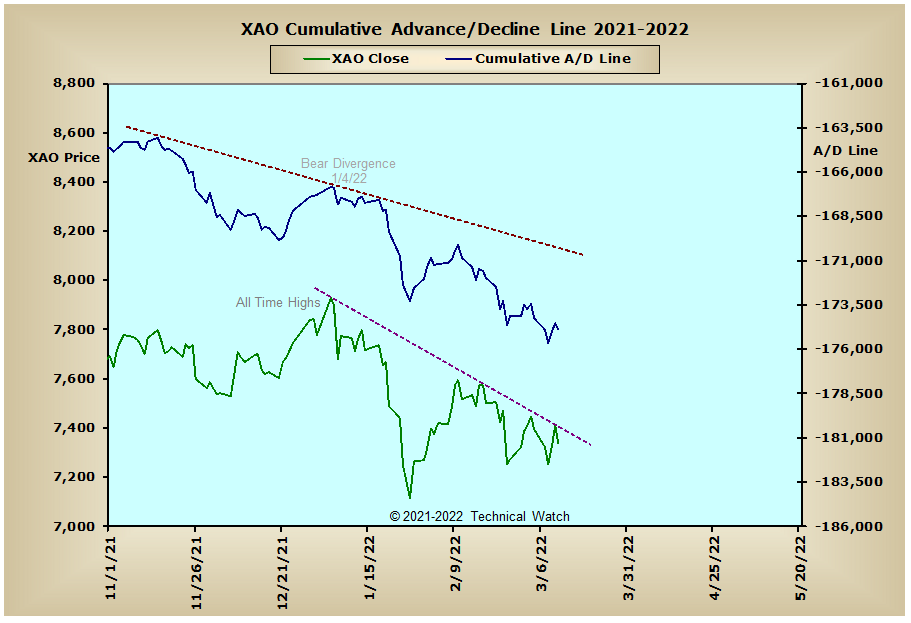
England: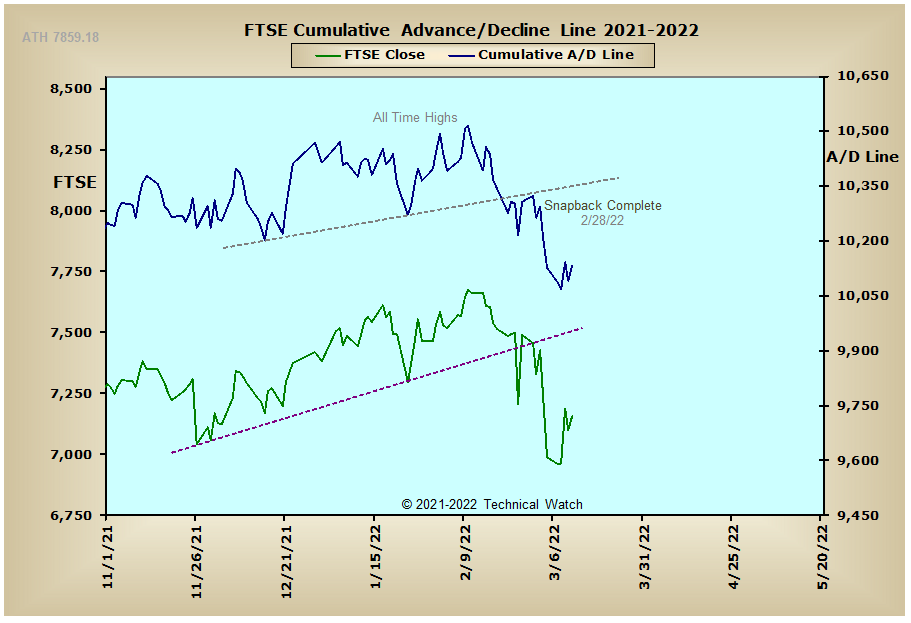
France: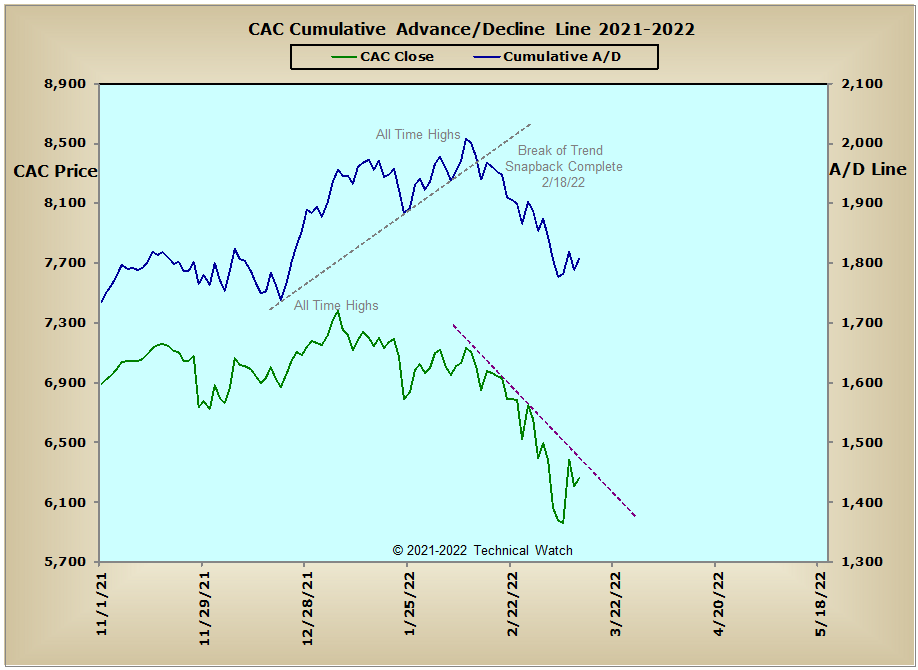
Germany: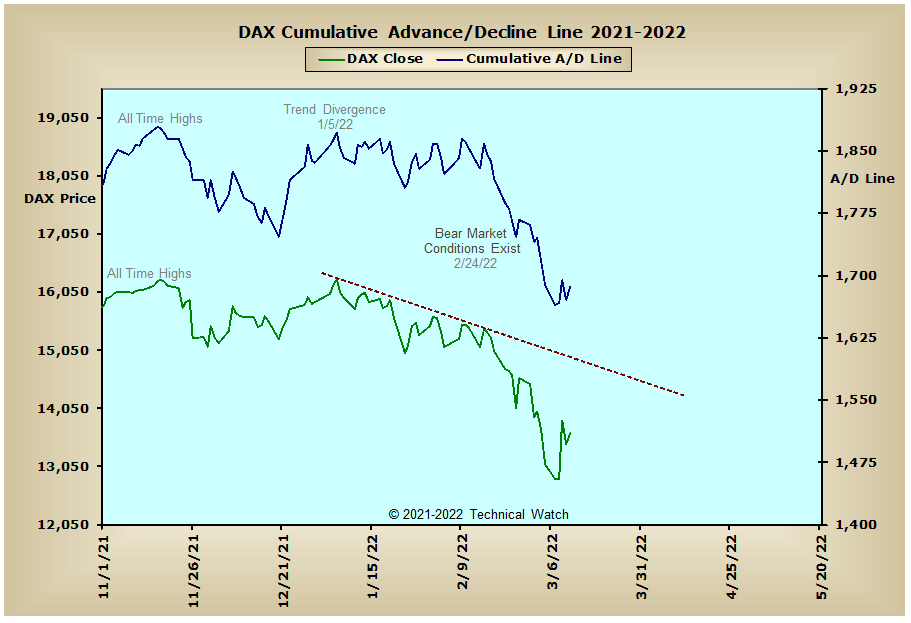
India: