After a rough start on Monday, our taking a more neutral stance this past week turned out to be the right call as additional short covering, as well as fresh investment capital coming off the sidelines, provided the impetus for prices in the major market indices to break out of their low level consolidation patterns and to or just above their 50 day EMA's to finish with an average gain of +3.08%. This was the largest average weekly gain since the week ending June 24th, with the added bullish bonus of the indexes finding longer term price pattern support at their 200 week EMA's after consolidating at and around these same levels for the last month.
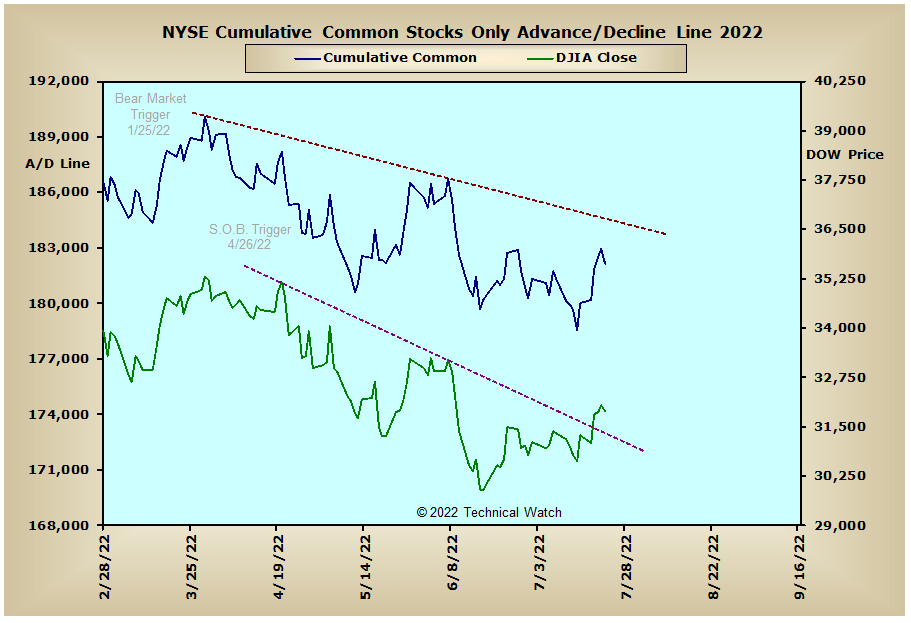
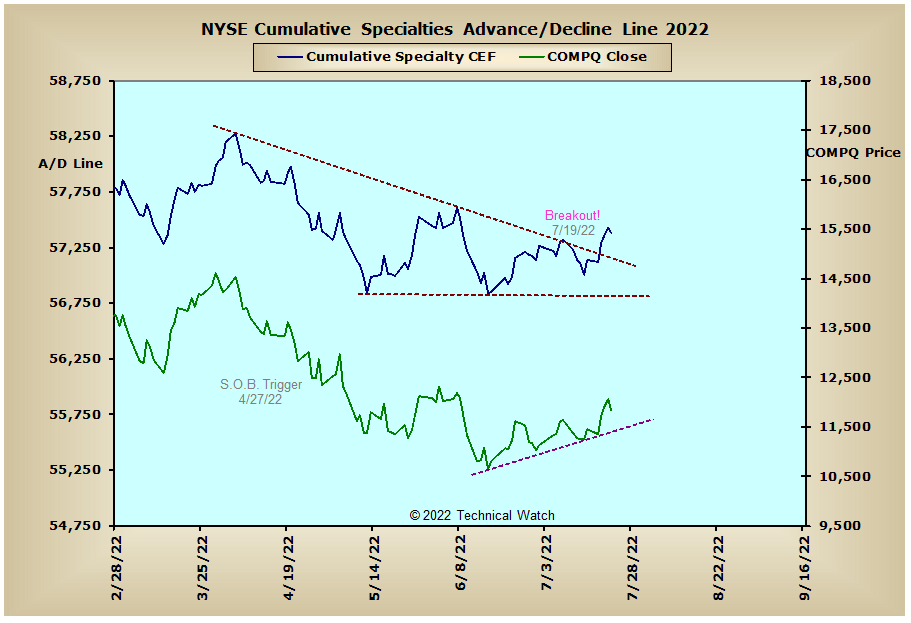
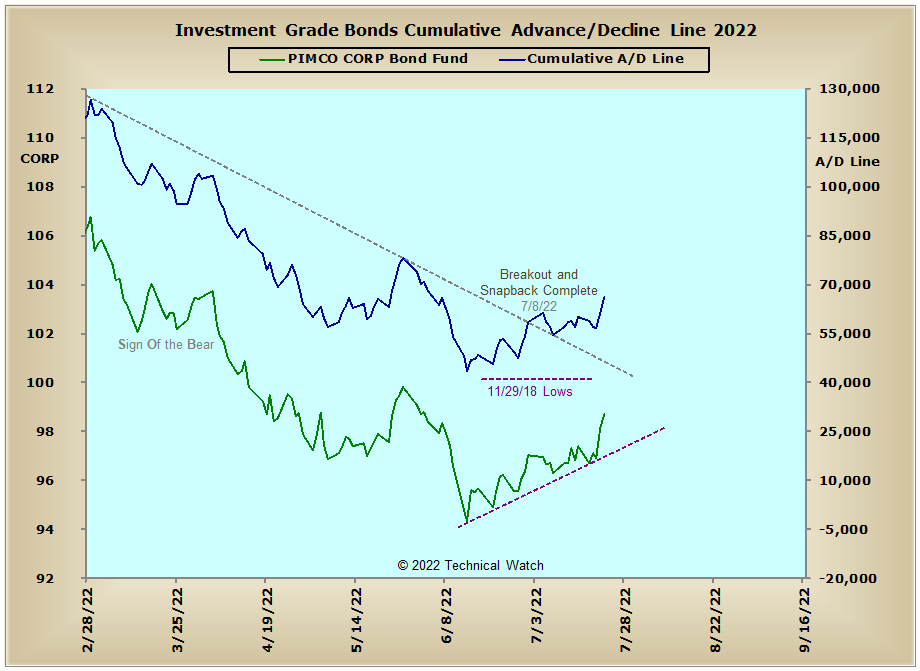
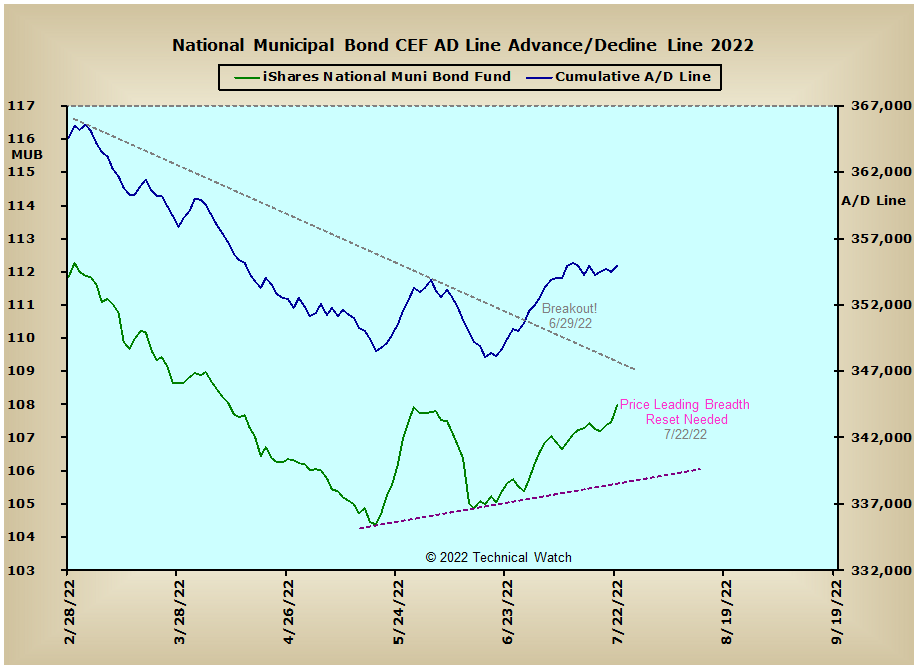
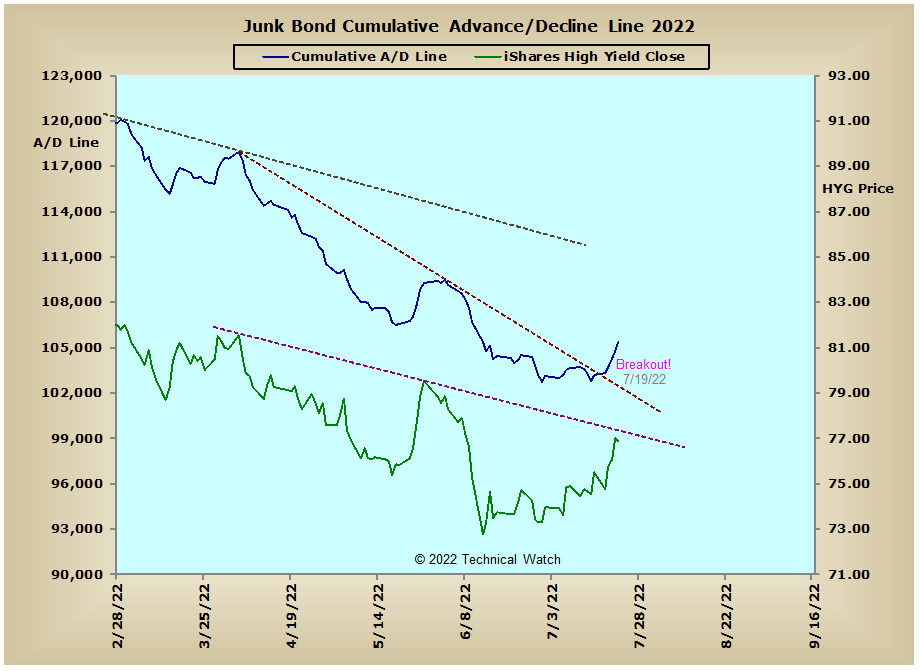
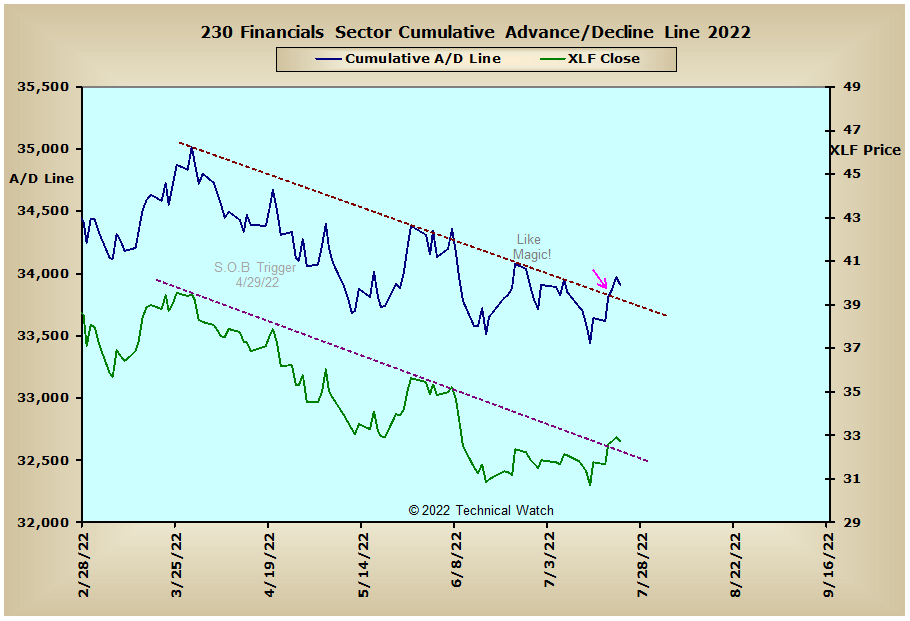
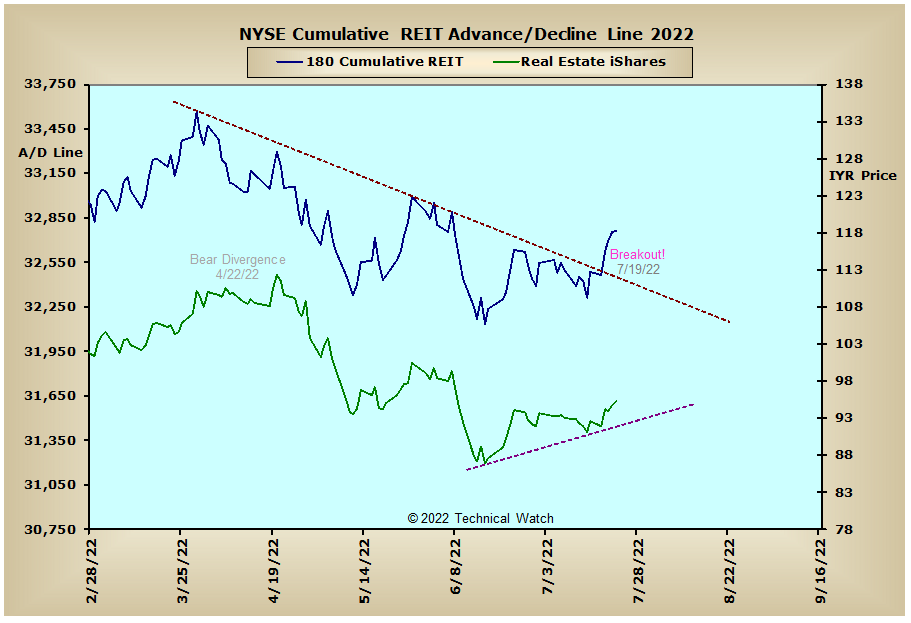
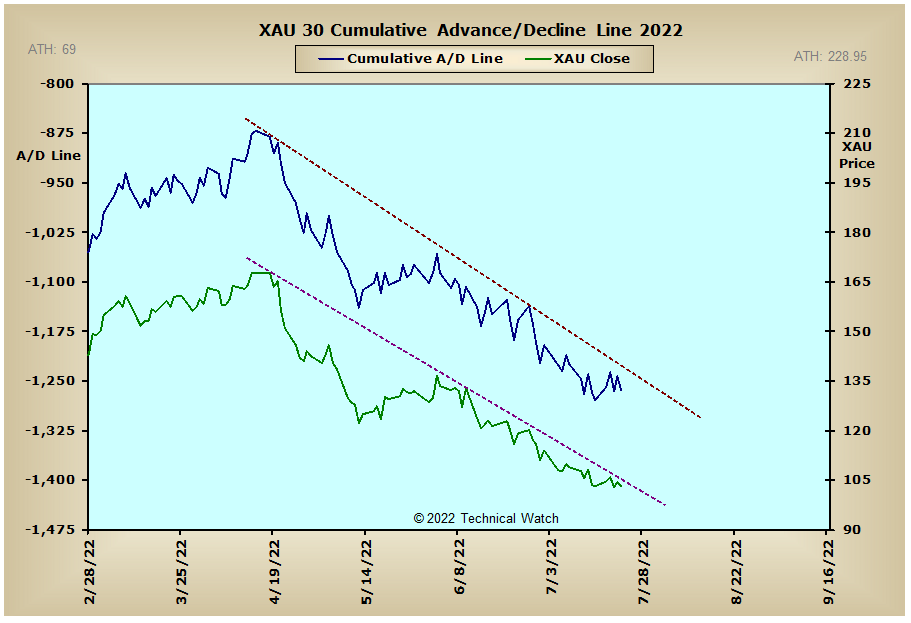
Looking at our usual list of cumulative breadth charts for this week shows that the A/D lines of the interest rate sensitive issues that trade on the NYSE continue to move higher as we see that both the Junk Bond and NYSE REIT advance/decline lines have now joined the others in finishing above their intermediate term declining trendlines. This continued strength in the debt asset class also allowed the NYSE Composite advance/decline line to close just above its declining tops line going back to the beginning of April, while at the same time, the NYSE Common Only advance/decline line still remains below this same line of resistance. There were also upside trendline breakouts noted in the NYSE Specialty, Russell "1987" and Financial Sector advance/decline lines as well, while the NASDAQ up/down (volume) line (NAUD, see cumulative charts) finished the week in new all time high territory. On the negative side of things, both the Precious Metals and XAU advance/decline lines continue to trend lower, but if a more neutral stance in interest rate policy by the Federal Reserve turns out to be a reality as we move into the fourth quarter, we should expect that all of the metals will see price pattern support over the coming weeks...especially since the minimum downside price objectives for all were reached a week ago.
So with the BETS still showing a negative trading environment at -60, traders and investors continue to have a longer term bearish bias toward equities. After reaching their highest levels since early June, all of the breadth McClellan Oscillators finally pulled back a bit on Friday from their highly "overbought" levels. With only a lessening of selling pressure and no divergences noted with the price pattern lows of July 14th, these same MCO's will need to provide either advancing or sideways up and down "texture" in their daily patterns to provide an internal foundation solid enough for prices to use as underlying strength later on. Currently, the strongest areas of money flow are in the growth stock issues that make up both the NASDAQ Composite and the S&P 600 Small Cap Index' as traders maintain the opinion of a more neutral stance to the hawkish Federal Reserve monetary policy of the last several months. Friday's reading in the NYSE TRIN of 1.96 shoved the NYSE Open 10 TRIN back into deeply "oversold" territory at 1.23, while the NASDAQ Open 10 TRIN is now back below "overbought" levels at .82. With index price charts still supporting longer term bearish EMA configurations, the buyers have quite a bit of work to do before it can be suggested that they have turned the longer term trend in prices from down to up. In fact, without providing an across the board washout back in June, stock prices still have unfinished technical business yet to be seen for a more longer lasting tradable bottom. With all this as a backdrop then, let's continue to take a more neutral stance toward equities for the week ahead, and until various index price charts can show their respective 20 day EMA's moving back above their 50 day EMA's, continue to expect any short term surprises siding with the longer term bearish path of least resistance.
Have a great trading week!
US Equity Markets: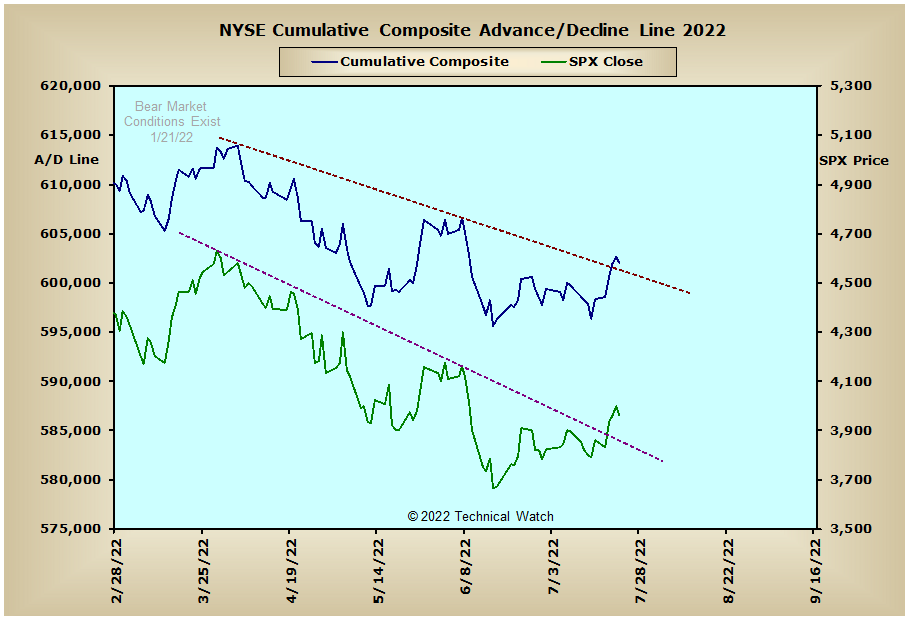
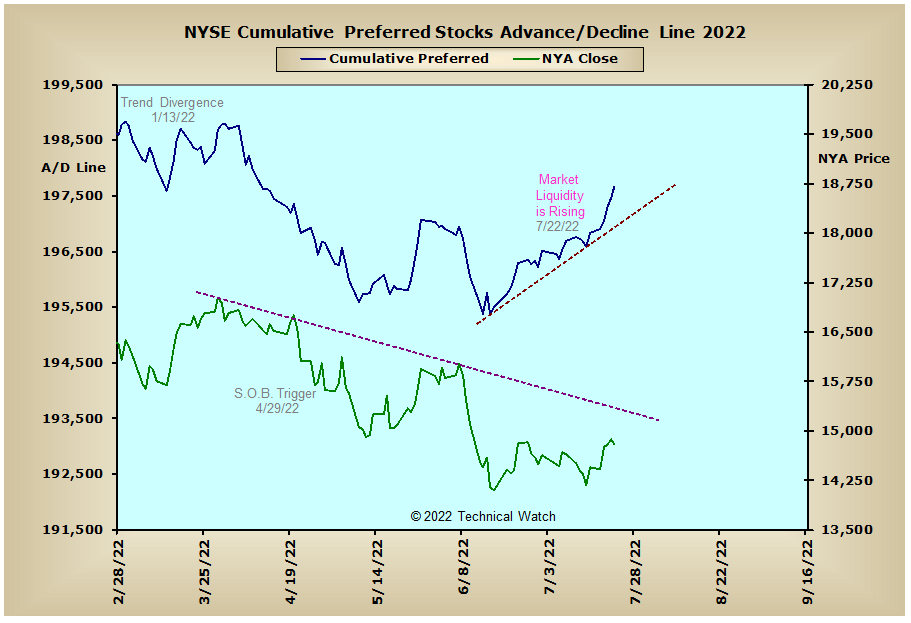

US Interest Rates: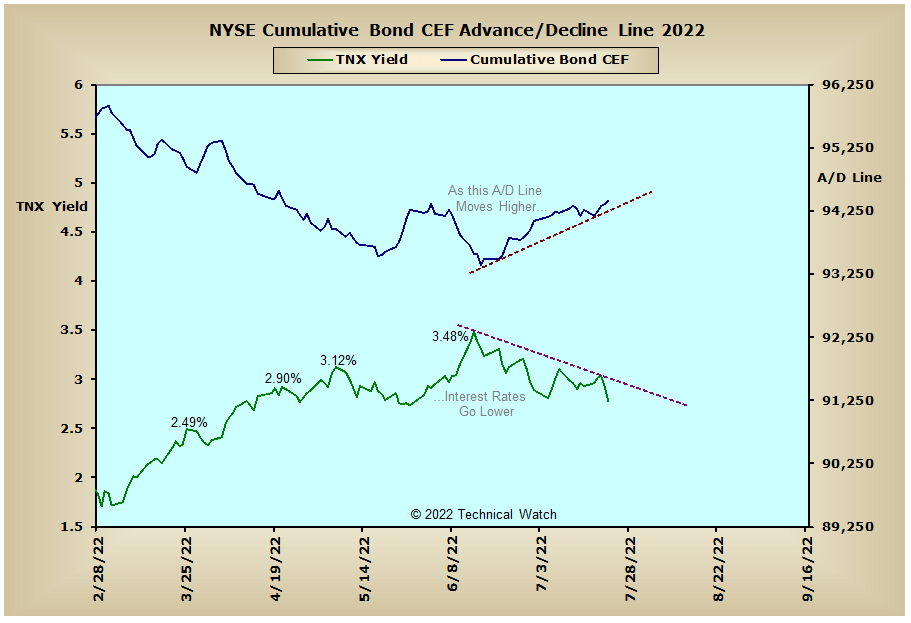
US Sectors: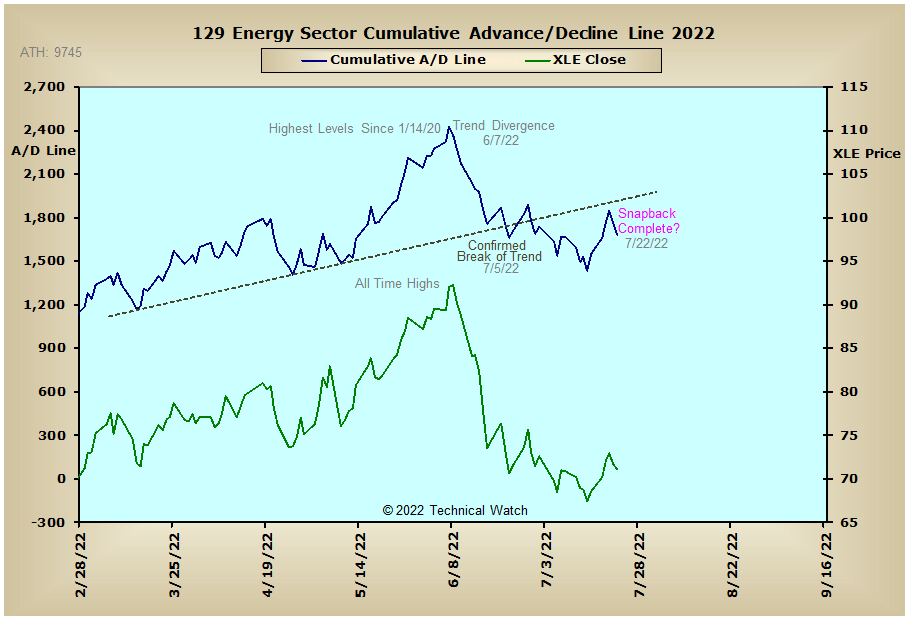
Precious Metals: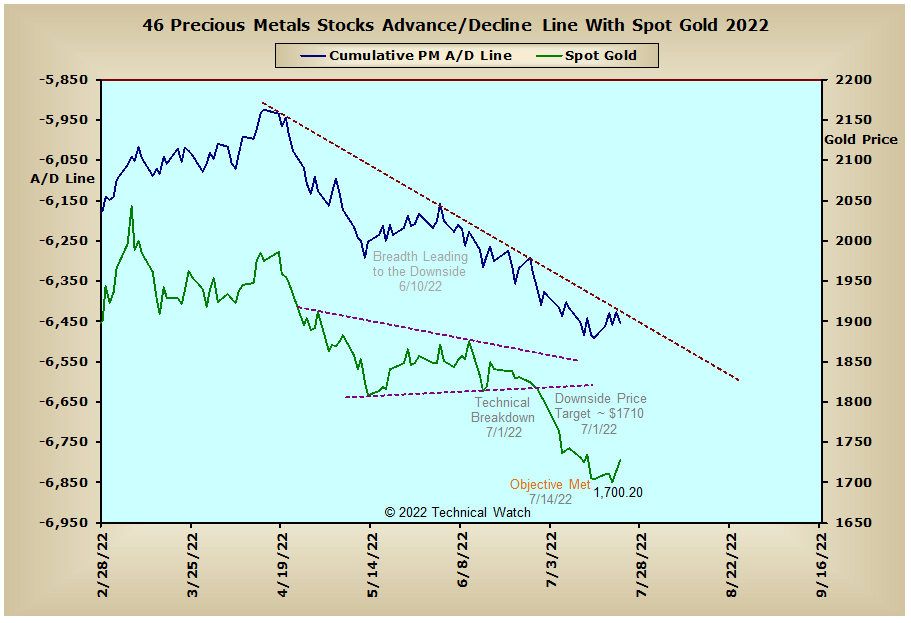
Australia: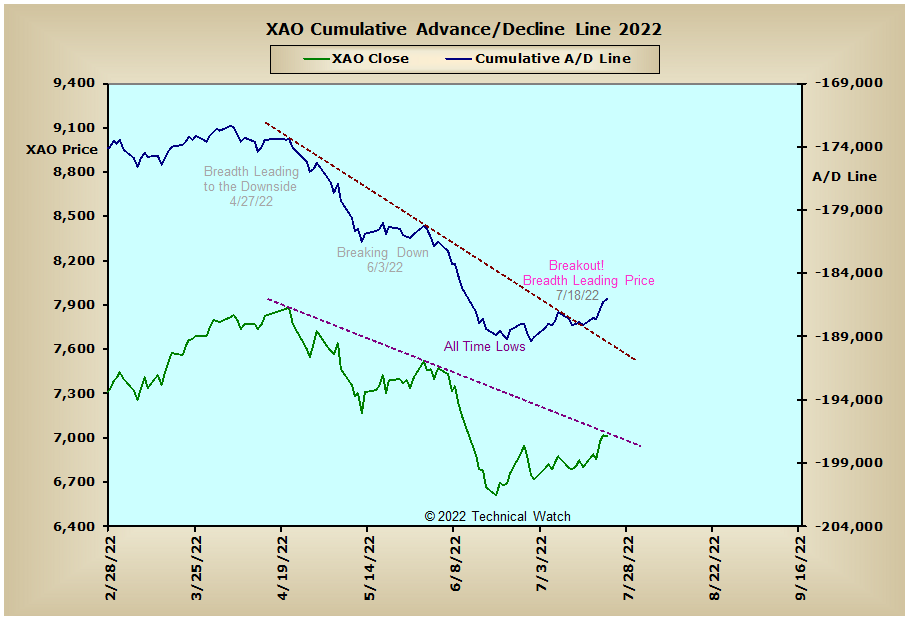
England: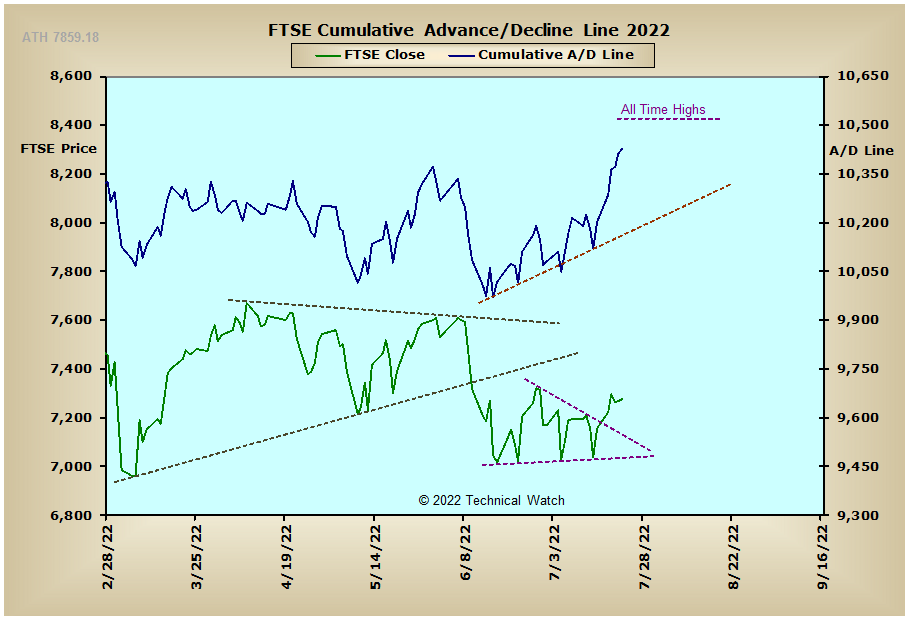
France: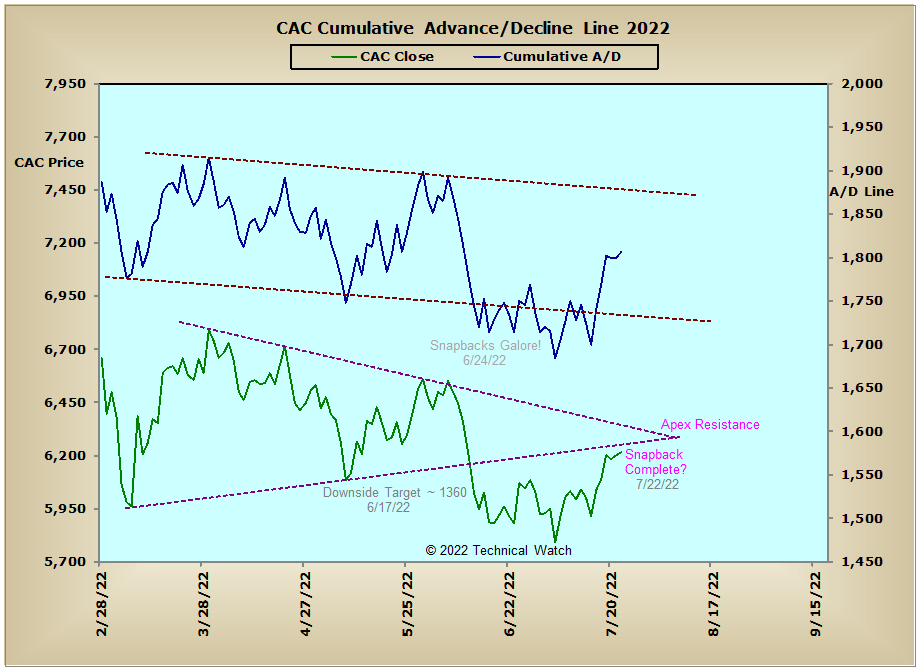
Germany: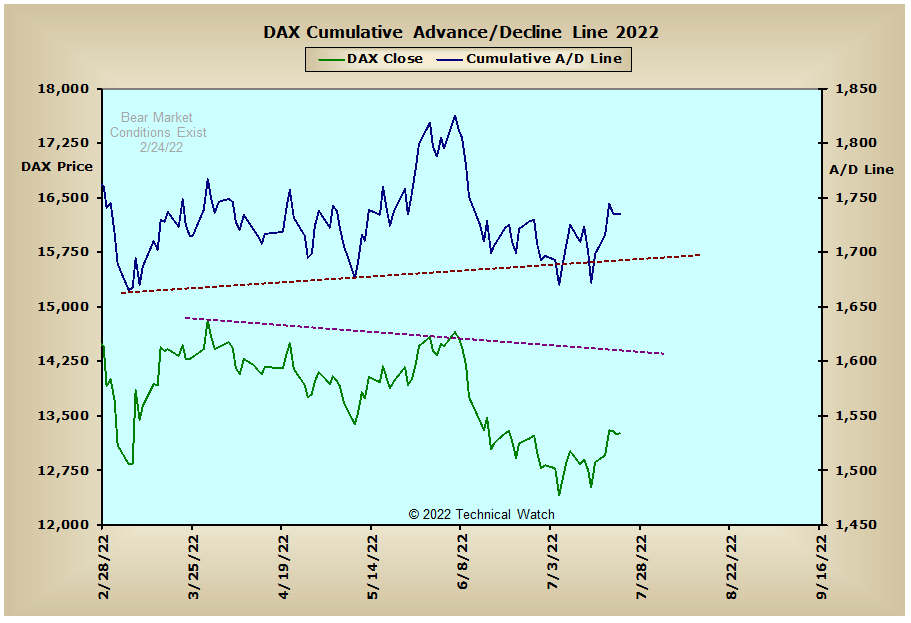
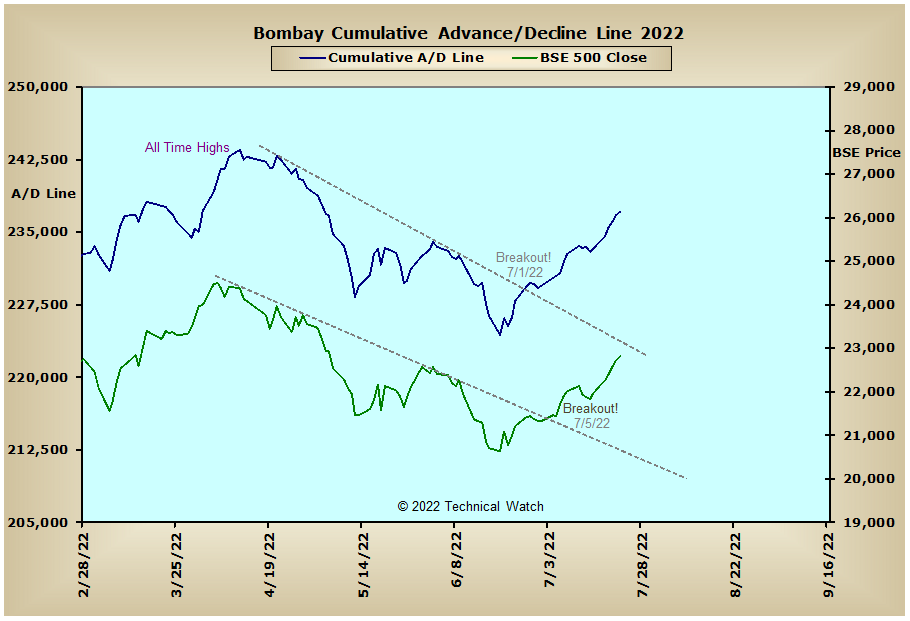
India: