The major market indexes continued their price consolidations for the month of October as many rebounded sharply higher for the week, with some even finishing back above their important 200 week EMA's. Once Friday's closing bell was finally rung, the markets settled with an average weekly gain of +4.19% to fully squash any leftover speculative put buying that was purchased during the month of September's sharp declines.
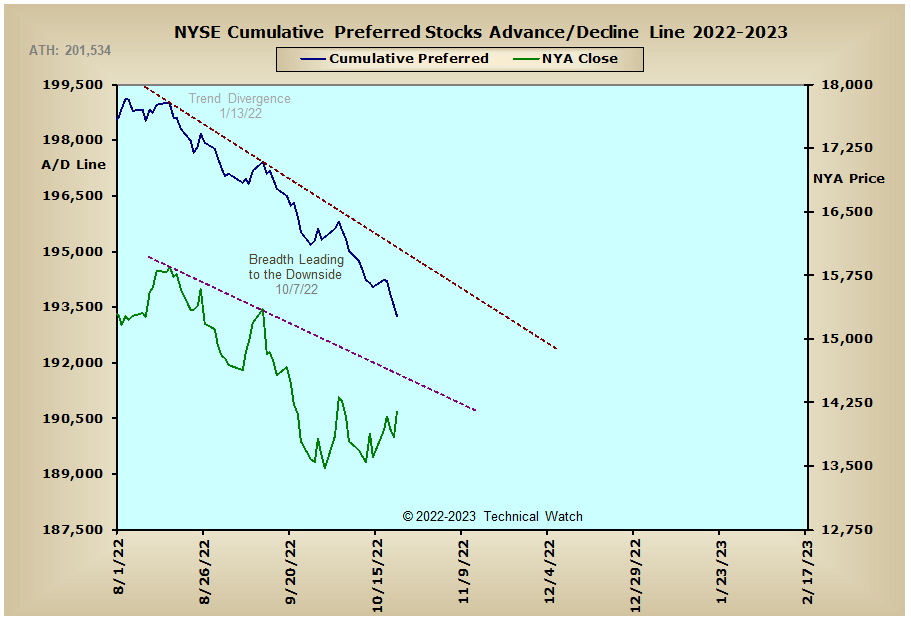
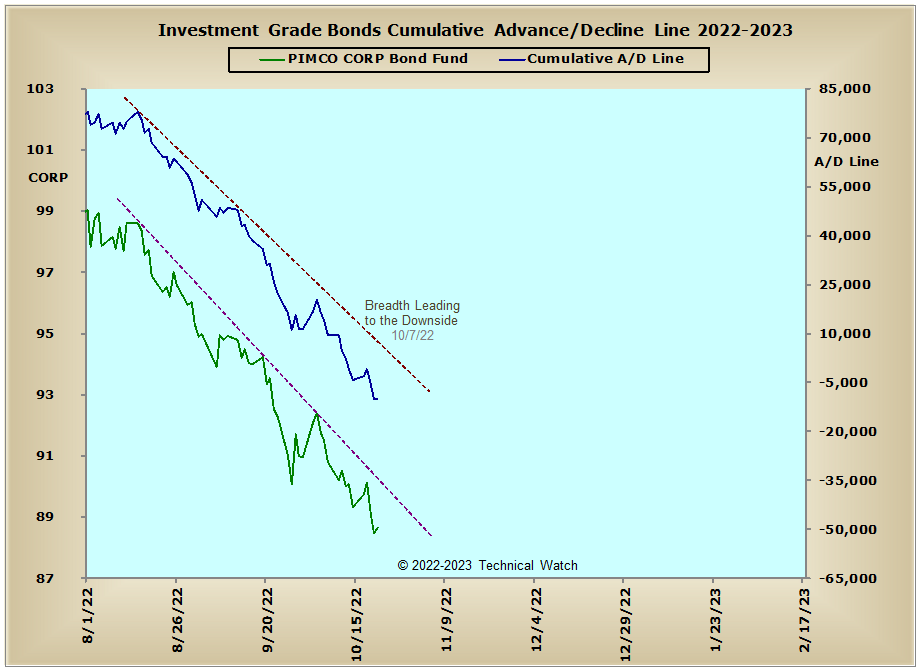
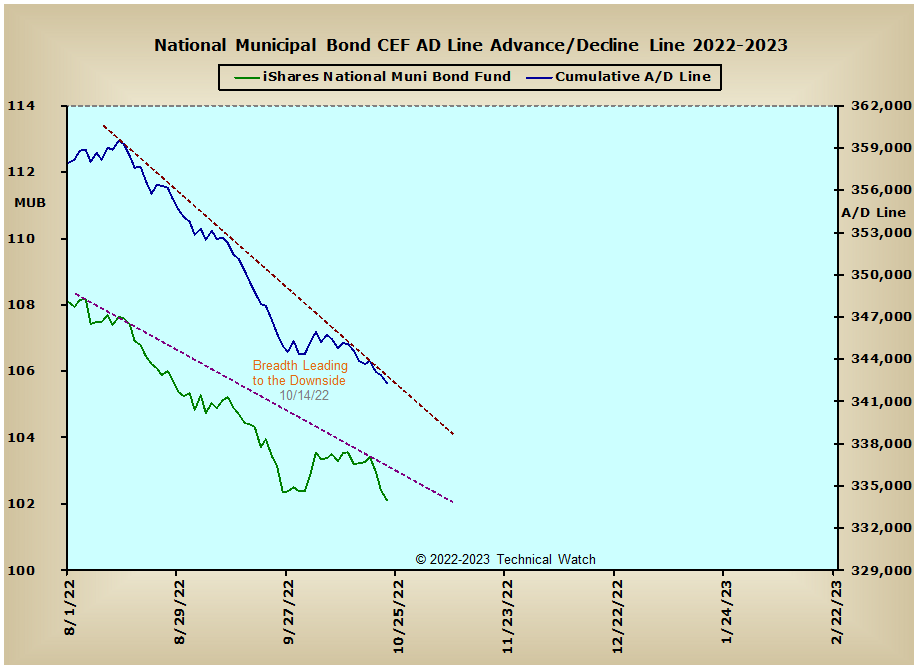
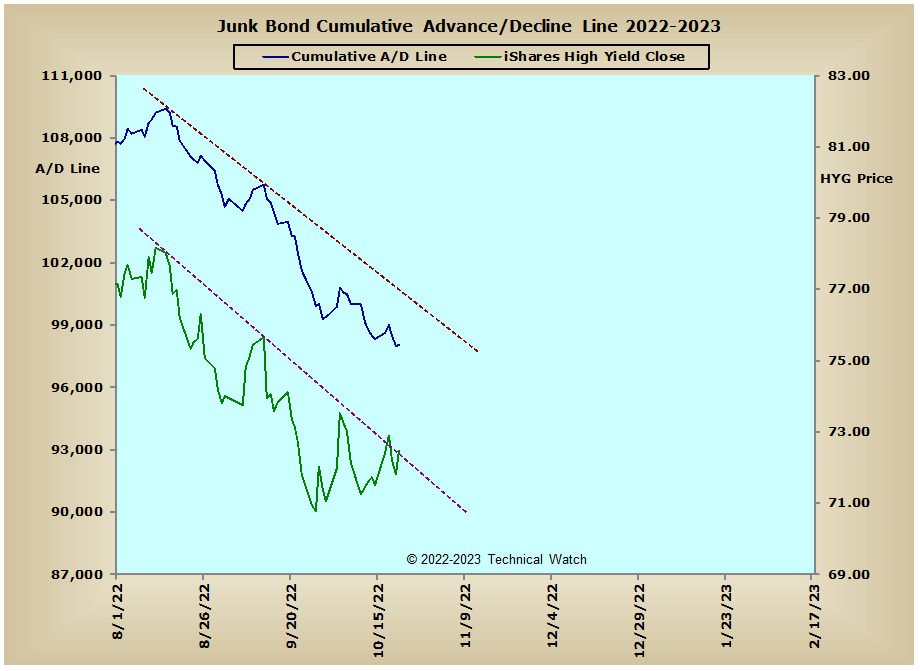
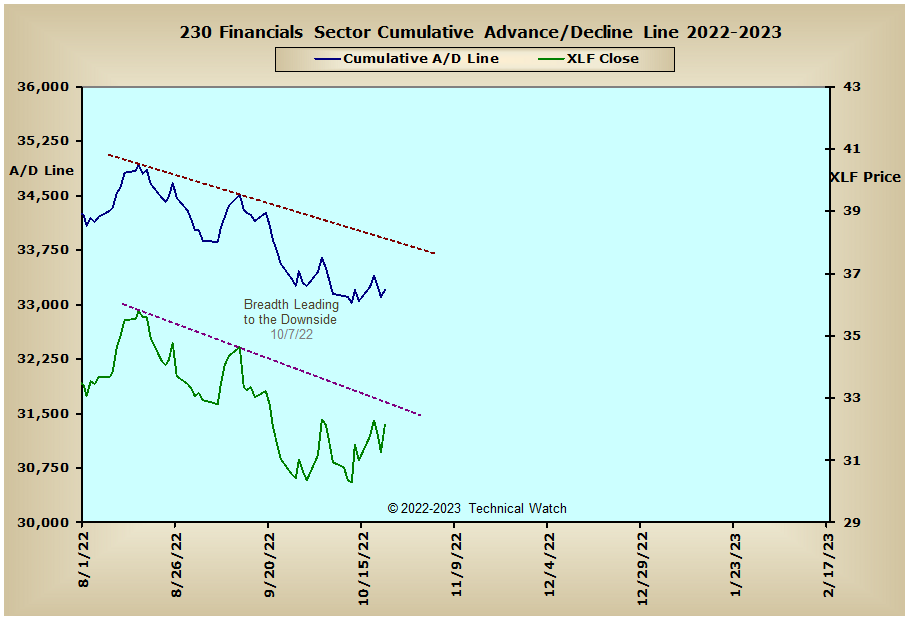
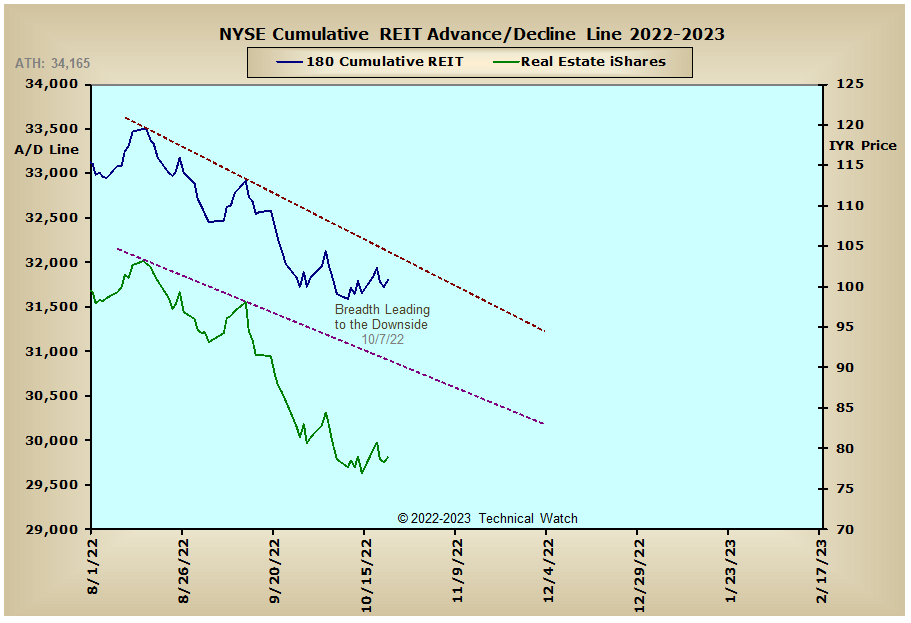
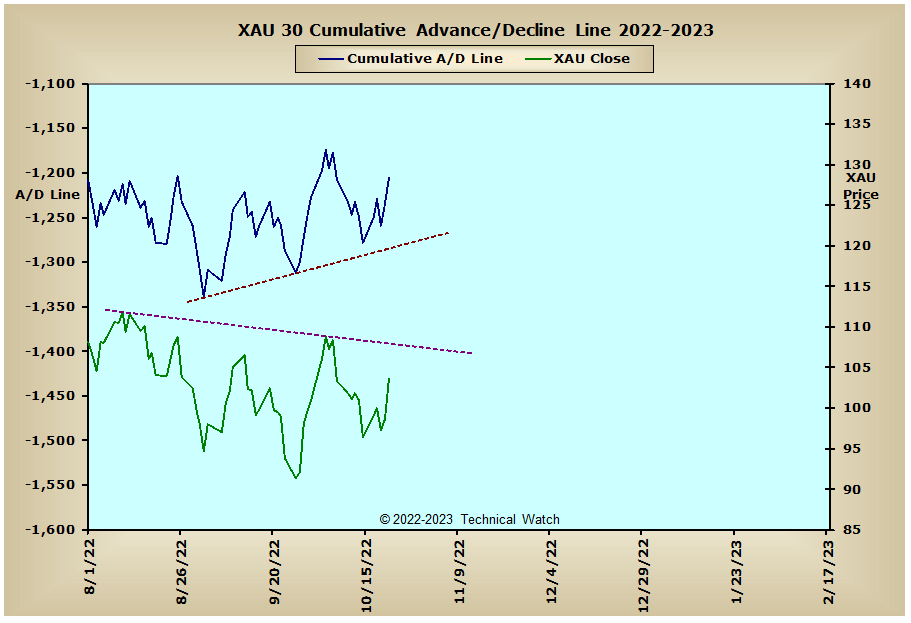
Looking at this weeks edition of cumulative breadth charts shows that the interest rate sensitive issues continue to move aggressively to the downside as the advent of further FED tightening remained the main focus. This proved to have the usual internal consequences of a bear market rally with all of the equity related advance/decline lines showing non confirmations of last week's reflex rally. Both the Precious Metals and XAU advance/decline lines continue to show further inflows of investment capital in spite of interest rates continuing to climb for the week. However, this still hasn't, as yet, fully translated into higher prices in gold and silver stocks, with the continuing expectation of a tradable bottom in this asset class still yet to come sometime in December.
So with the BETS finishing the week at -60, current conditions still suggest to maintain a negative trading bias. Looking at the breadth and volume McClellan Oscillators and all continue to show a strong pattern of bottoms above bottoms since the late September lows. This "lessening of selling pressure" continues to keep prices buoyant as we go into the end of the month and, now likely, into the beginning of November and the mid term elections on November 8th here in the United States. The 10 day moving average of put/call ratios continues to reflect a marketplace that is closer to a top than that of a bottom, while the NYSE Open 10 Trading Index closed on Friday at an "overbought" reading of .77 and almost matching the .75 signal we had when prices topped out on September 12th. With all this pushing and pulling going on right now, this would suggest that prices will likely be range bound for the week ahead with continued intraday volatility. With all this as a background then, let's again continue to favor the bearish path of least resistance, though the short term course ahead might be a bit uneven in spots which will need our constant monitoring as it applies to sector rotation.
Have a great trading week!
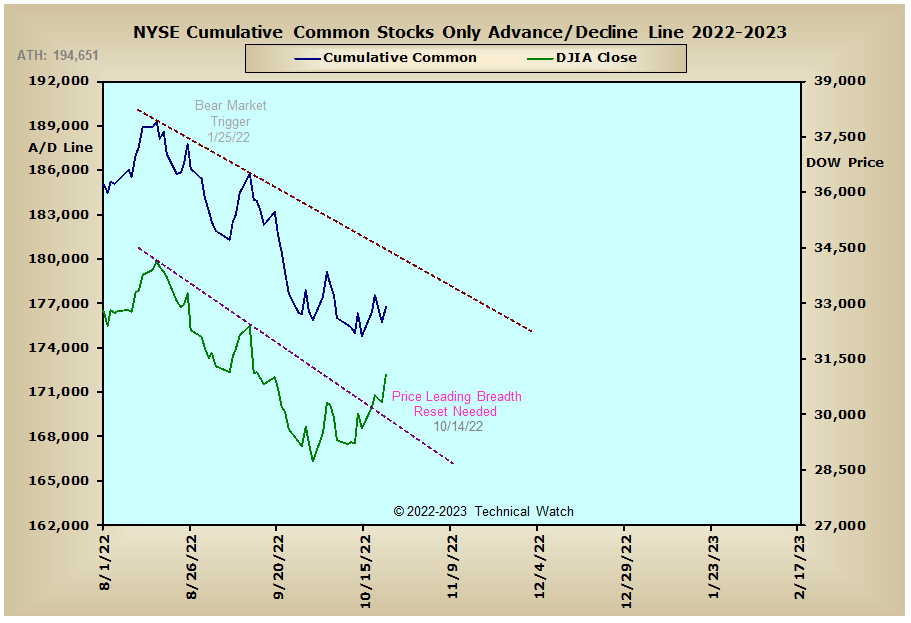
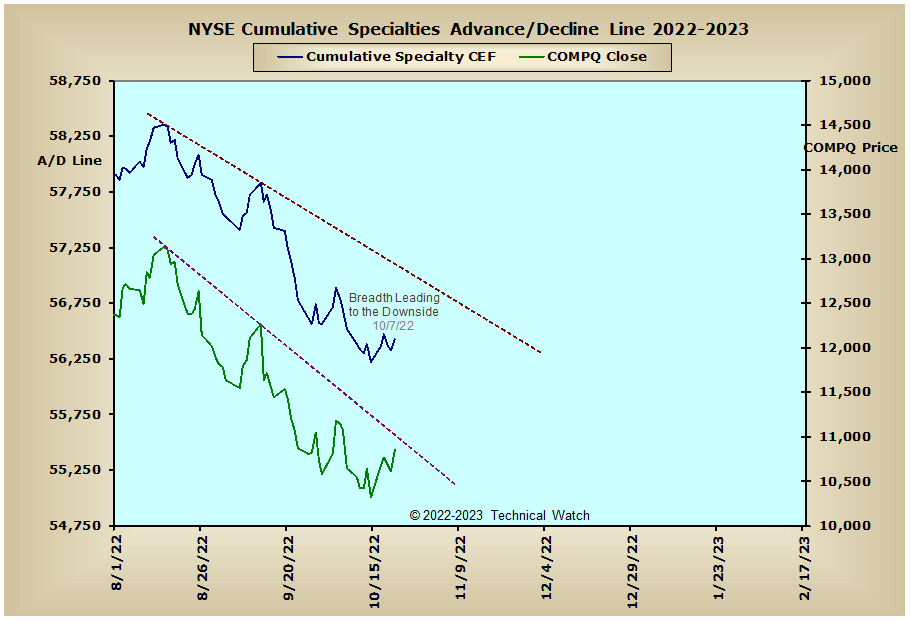
US Equity Markets: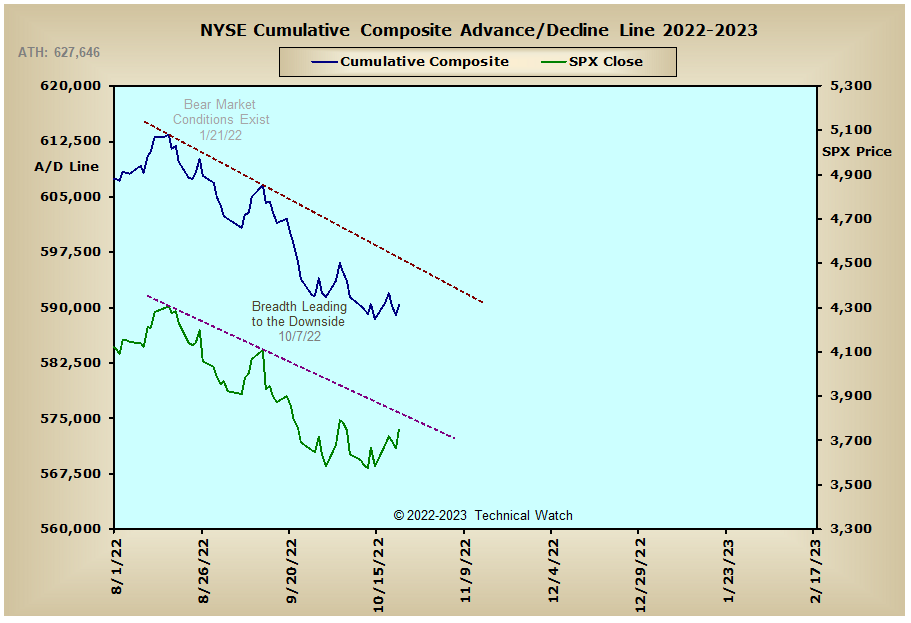

US Interest Rates: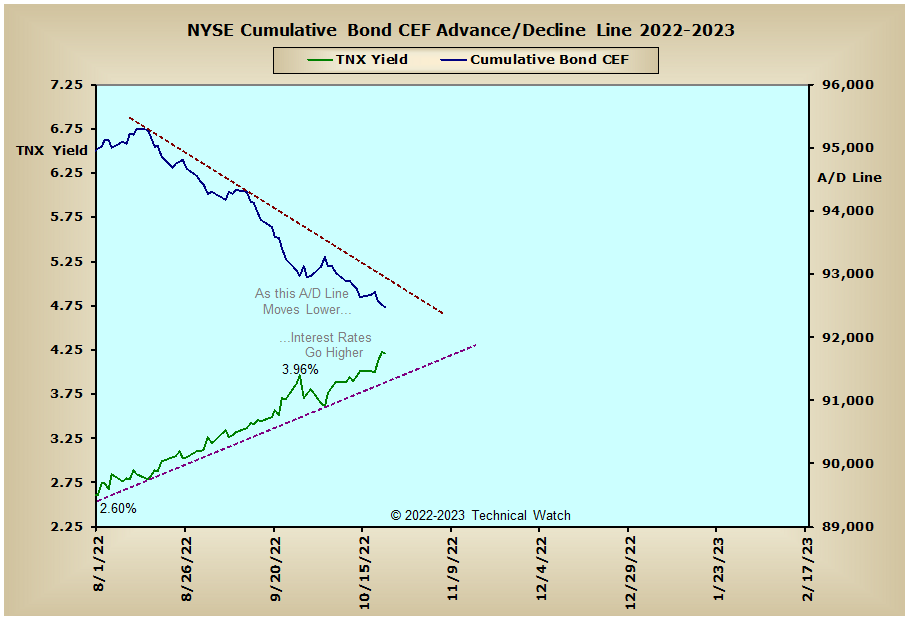
US Sectors: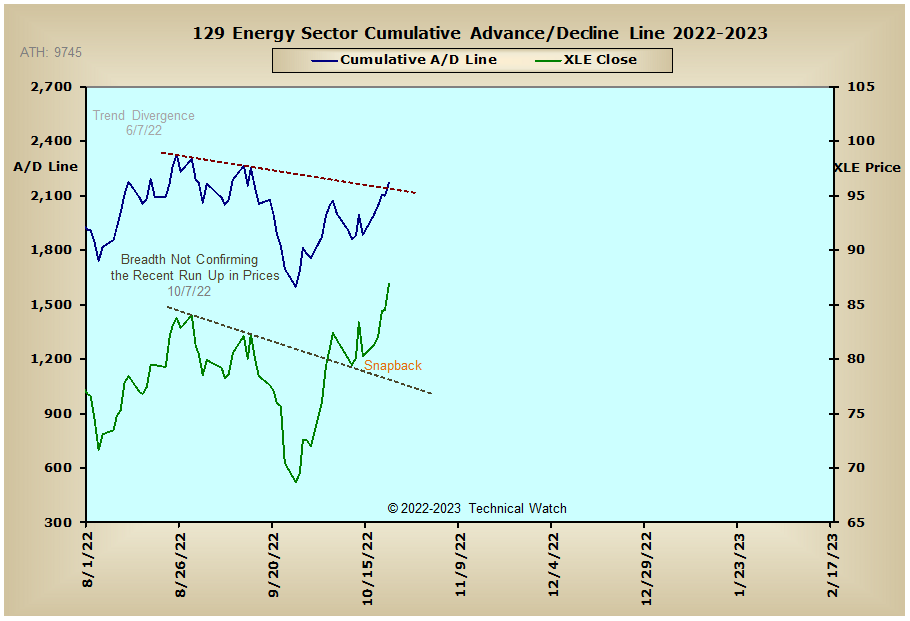
Precious Metals: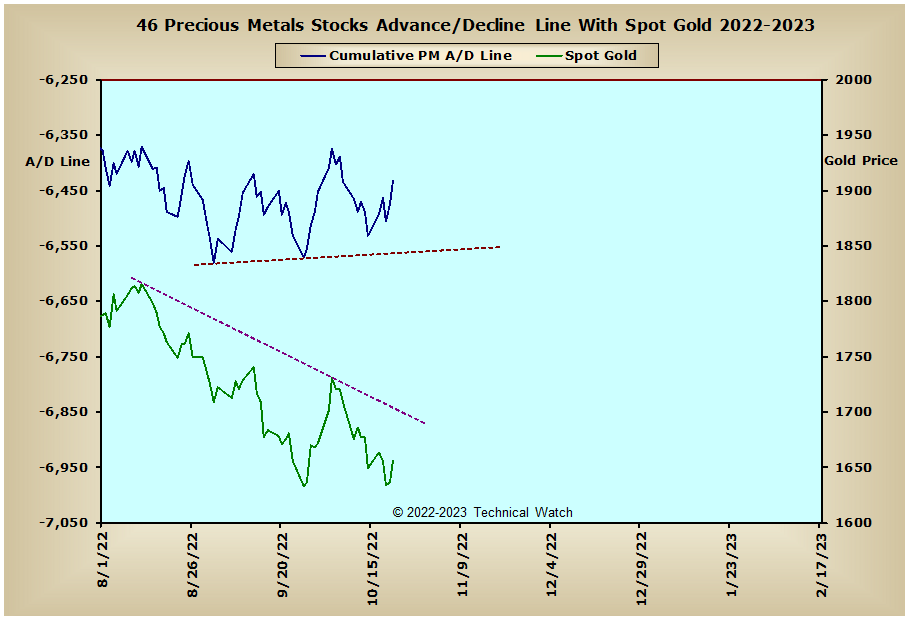
Australia: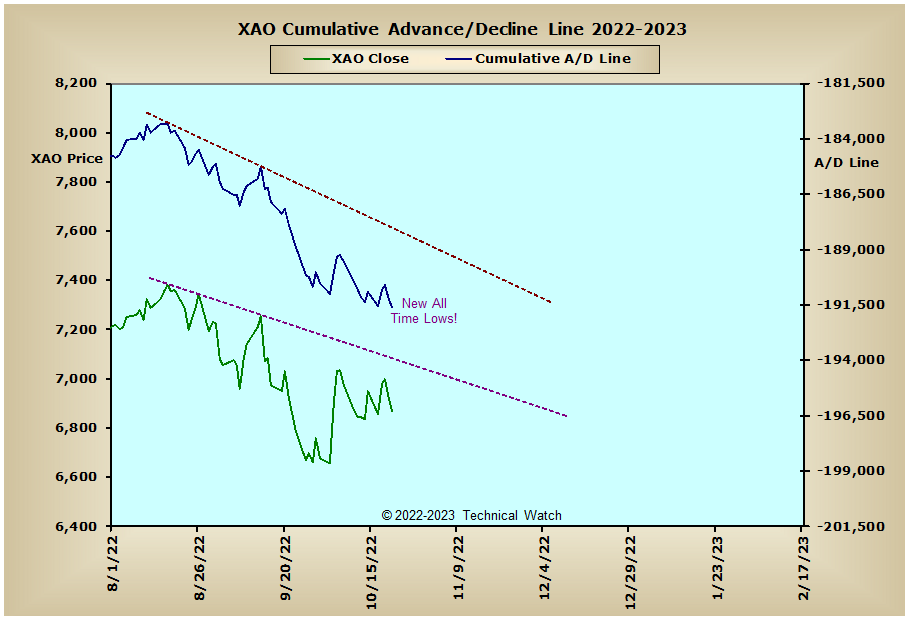
England: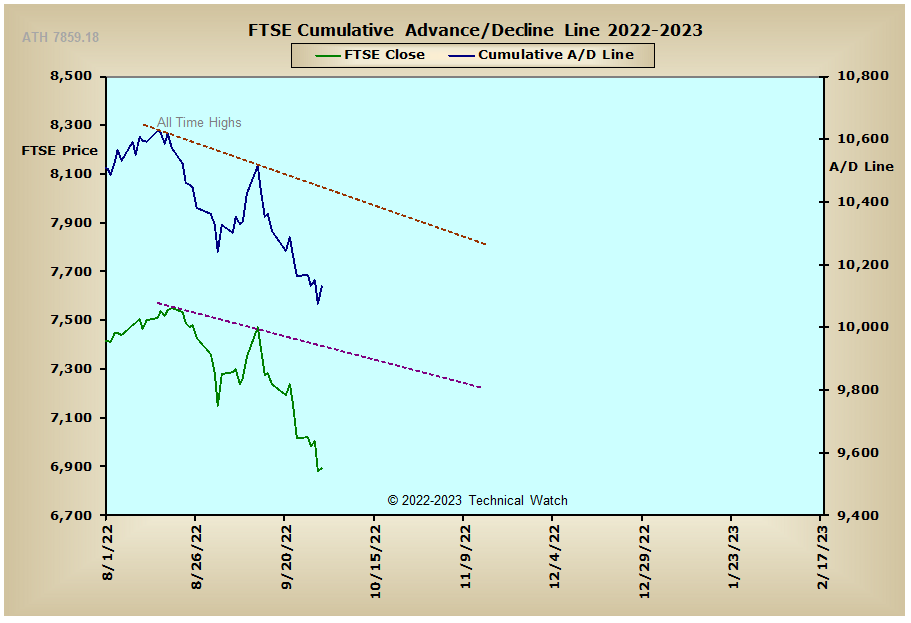
France: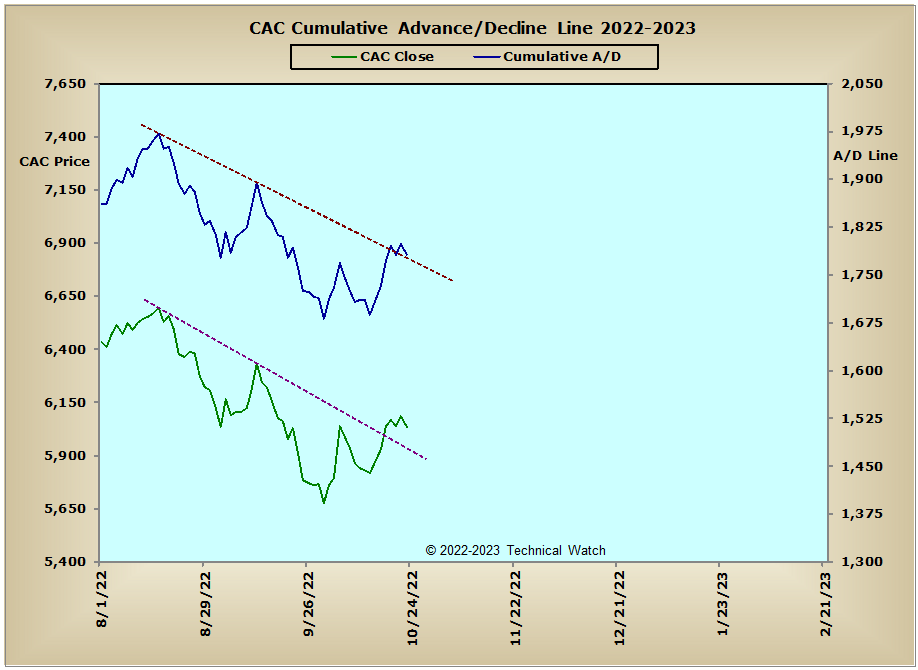
Germany: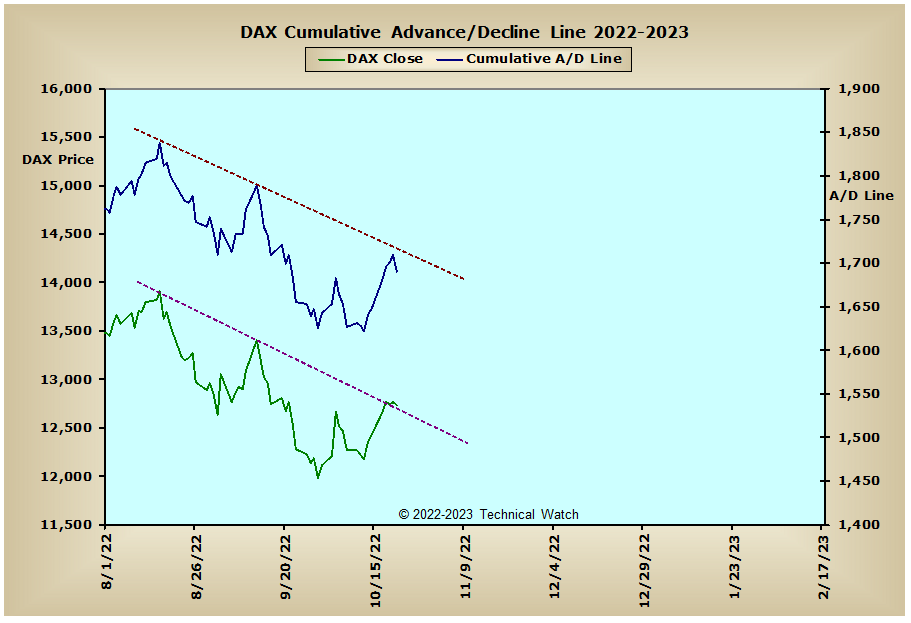
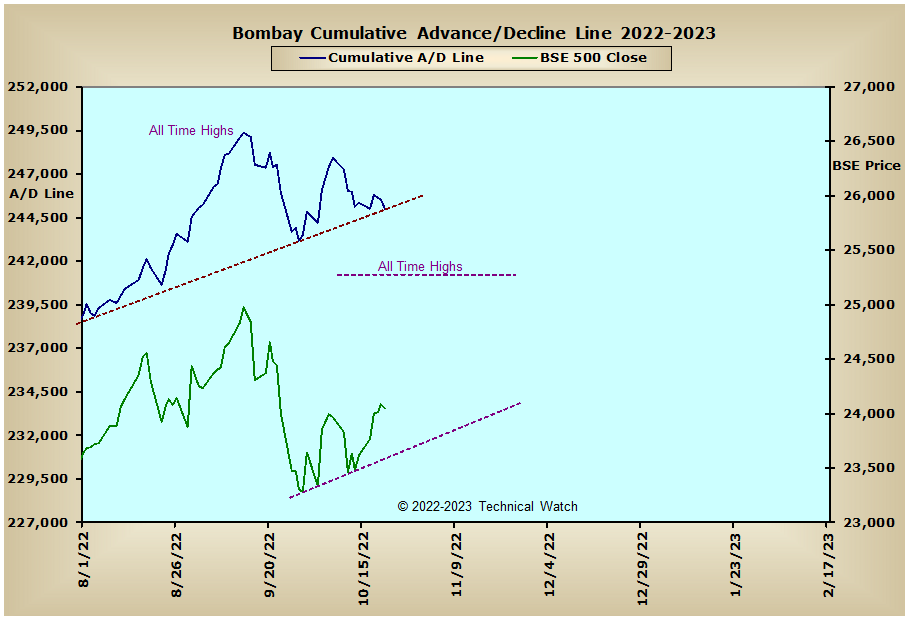
India: