Jump to content


Photo

Longer Term Gold Upside Price Objective Chart

Gold

  • Please log in to reply
8 replies to this topic

#1 fib_1618

fib_1618

    Member

  • Traders-Talk User
  • 10,198 posts

Posted 11 February 2025 - 09:47 AM

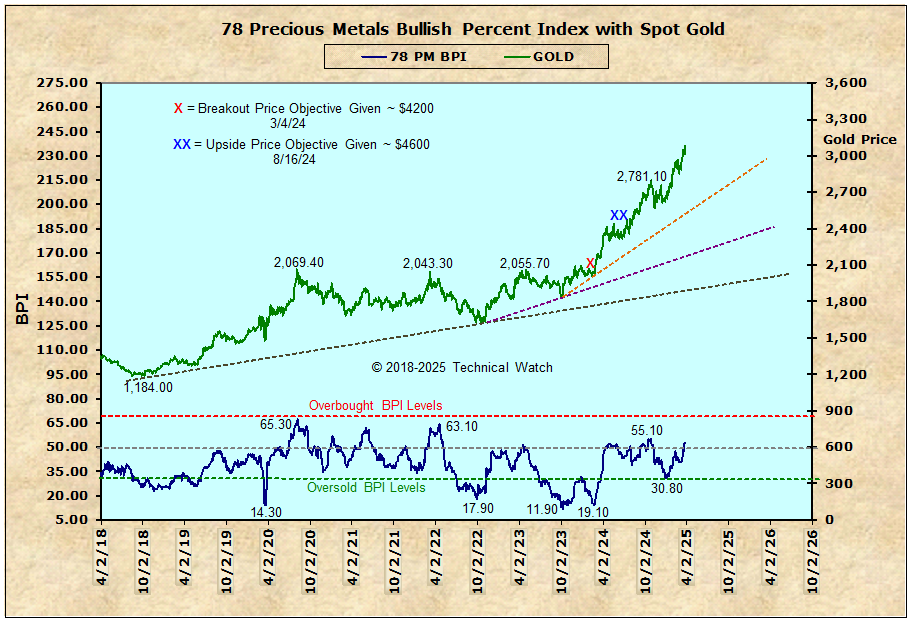
I was asked privately to provide an updated chart for the price of gold with the PM BPI data...here you go through February 7th.


Still looking to be on target...let's average between the two price objectives at around $4400.


The small triangle breakout of mid January is around $2975.


Fib


https://tinyurl.com/25bzr4vs


ltgold021125.png


Edited by fib_1618, 11 February 2025 - 09:51 AM.

Better to ignore me than abhor me.

“Wise men don't need advice. Fools won't take it” - Benjamin Franklin


"Beware of false knowledge; it is more dangerous than ignorance" - George Bernard Shaw


Demagogue: A leader who makes use of popular prejudices, false claims and promises in order to gain power.




#2 Paul

Paul

    Member

  • Traders-Talk User
  • 36 posts

Posted 11 February 2025 - 10:02 PM

Hi Dave, hope you are doing well. Thanks for sharing your chart with the price objectives. Would you mind expounding on how you arrived at those targets? I know I would like to see how you came to those numbers and other members may benefit as well.

Thanks


#3 fib_1618

fib_1618

    Member

  • Traders-Talk User
  • 10,198 posts

Posted 12 February 2025 - 01:12 PM

Hi Dave, hope you are doing well. Thanks for sharing your chart with the price objectives. Would you mind expounding on how you arrived at those targets? I know I would like to see how you came to those numbers and other members may benefit as well.

Thanks


Hey Paul...thanks for the question!!


The upside price target for the first price objective from last March is taking the length (via a ruler) of the 4 year trading range from 2020 to 2024 and flipping the length vertically which was about $2000 from the breakout point. The second target projection is also taking the smaller 2024 trading range and flipping that as well PLUS upside breakouts in the the Precious Metals McClellan Summation Index were applied in relation to its past breadth (and daily volume) amplitudes (the amount of money (energy) provided by investment capital) to get the ~$4600 target. Given that we are dealing with uncharted territory for both numbers, if we average the two numbers this would (at least) give us a price zone in which to look for a potential exit point given if no other targets are generated beforehand (there will likely be others to help pinpoint the actual number as we move along this path of least resistance). The objective from January is taking the widest distance of the symmetrical triangle from early November and applying that length from the January breakout point which measured to ~$2975. All projections are on a closing basis. It's also important to understand that the time it takes to reach any and all price targets is not considered...only that there is enough fuel to eventually reach these same forecasts. Based on that, these technical chart related price goals (roadmap) are more for the average investor as opposed to the shorter term nature of that of a trader.


Follow up questions are encouraged.


Fib


Better to ignore me than abhor me.

“Wise men don't need advice. Fools won't take it” - Benjamin Franklin


"Beware of false knowledge; it is more dangerous than ignorance" - George Bernard Shaw


Demagogue: A leader who makes use of popular prejudices, false claims and promises in order to gain power.


#4 Paul

Paul

    Member

  • Traders-Talk User
  • 36 posts

Posted 13 February 2025 - 11:32 AM

Thanks for taking the time to give a detailed explanation. I had two follow up questions. You already answered one in saying time is not considered in possible

reaching the targets. So my only other question would be what would have to happen for these targets to get canceled? Breaking a certain support or a certain

price? Or maybe something inside the Precious Metals Summation index?


#5 fib_1618

fib_1618

    Member

  • Traders-Talk User
  • 10,198 posts

Posted 14 February 2025 - 04:36 PM

Thanks for taking the time to give a detailed explanation. I had two follow up questions. You already answered one in saying time is not considered in possible

reaching the targets. So my only other question would be what would have to happen for these targets to get canceled? Breaking a certain support or a certain

price? Or maybe something inside the Precious Metals Summation index?


Cancellation of price targets of this type vary, but usually the first warning shot comes with a shorter term breadth measurement tool such as the McClellan Oscillator. If the MCO makes a new multi monthly low, for example, this might suggest that a prior price consolidation level will be tested and even violated if the "foot remains on the accelerator pedal" and lower lows are seen. But if we're talking intermediate to longer term price projections of which these are, then their births and deaths are based more on the position of the McClellan Summation Index in relation to its zero line which will give you a better roadmap of where prices are likely to reach during this same correctional (or advancing) sequence. Keep in mind that all of this also depends on where the 200 day EMA is in relation to price. For example, if you do see new MCO lows (money moving out the market at an accelerated pace), and the MCSUM moves down and through its zero line (the 19 day EMA crosses down and through the 39 day EMA on a breadth chart), but prices are above their 200 day EMA, then this would likely be more of a correctional sequence (a pause to refresh) than a change in trend. This would also mean that if prices are below their 200 day EMA under these same MCO and MCSUM conditions, then the odds increase greatly that you have bear market conditions and any upside targets would then be cancelled.


Unlike most who attempt to be strategic in providing price targets in either direction, if the money isn't there to reach such objectives, you're not likely going to attain them no matter what the time value would be. So, in this case, the current upside targets will remain until proven otherwise either by a change in the directional trend of money flow and/or by how prices are trending either above or below the magical 200 day EMA.


Bottom line...everything in trading is based solely on supply and demand, and the use of analytic tools that measure this basic monetary concept will provide the necessary insight to either enter or exit a trade without prejudice, emotion or hyperbole.


Fib


Better to ignore me than abhor me.

“Wise men don't need advice. Fools won't take it” - Benjamin Franklin


"Beware of false knowledge; it is more dangerous than ignorance" - George Bernard Shaw


Demagogue: A leader who makes use of popular prejudices, false claims and promises in order to gain power.


#6 Paul

Paul

    Member

  • Traders-Talk User
  • 36 posts

Posted 14 February 2025 - 10:02 PM

Once again, thanks for the follow up. For those who don't know, Dave has been on this board for a long time and has always been willing and dare

I say eager to graciously share his views with the board with follow up explanations if simply asked. Have always considered him to be one of the

best posters on the board and have learned alot from him sharing his technical analysis.


#7 fib_1618

fib_1618

    Member

  • Traders-Talk User
  • 10,198 posts

Posted 01 March 2025 - 05:18 PM

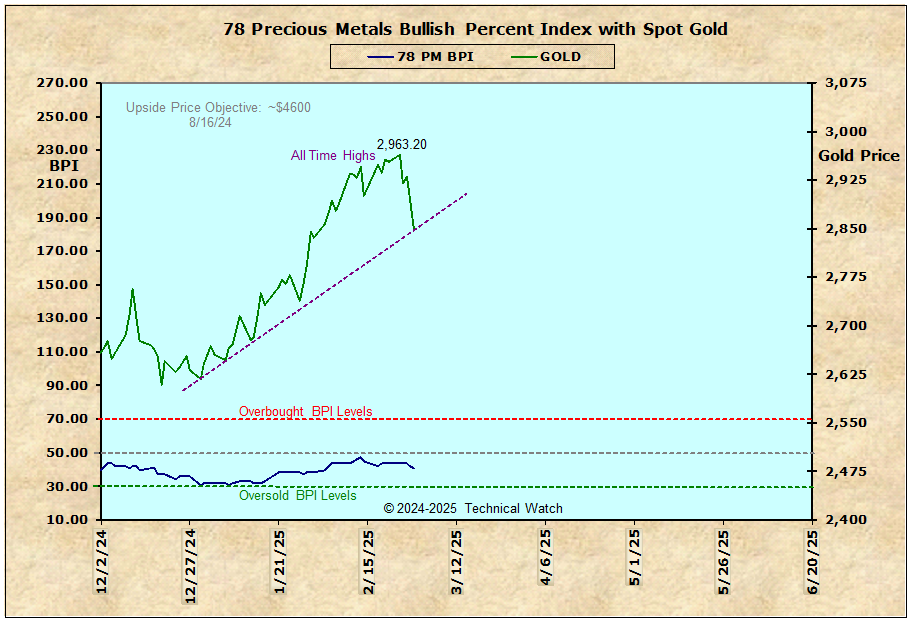
The small triangle breakout of mid January is around $2975.


Let's call the first upside price objective now met on February 24th with $2974.00 as the intraday high and $2963.20 on a closing basis.


Now back to trendline support with Friday's pullback.


Fib


https://tinyurl.com/2ahyrhso


goldbpi.png


Better to ignore me than abhor me.

“Wise men don't need advice. Fools won't take it” - Benjamin Franklin


"Beware of false knowledge; it is more dangerous than ignorance" - George Bernard Shaw


Demagogue: A leader who makes use of popular prejudices, false claims and promises in order to gain power.


#8 jacksterr

jacksterr

    Member

  • Traders-Talk User
  • 102 posts

Posted 02 March 2025 - 11:12 AM

Thanks for sharing your work.


#9 jabat

jabat

    Member

  • Traders-Talk User
  • 613 posts

Posted Yesterday, 08:42 AM

Excellent Tagets- now Goldman is supporting these targets.


Goldman Sachs says: We raise our end-2025 forecast to $3,300/toz (vs. $3,100) and our forecast range to $3,250-3,520, In extreme tail scenarios gold could plausibly trade above $4,200/toz by end-2025 and exceed $4,500/toz within the next 12 months.


Also tagged with one or more of these keywords: Gold