After a couple of days of churning to begin the week, the equity markets finally fell sharply on Wednesday with the Fed's policy statement announcement, and once that backing and filling event was finished, then proceeded to bounce higher on Friday with the jobs report to close out the week with an average loss of -2.39%. Leading the markets lower was the NASDAQ Composite Index which showed a loss of -5.65% while finding support at the base of its current trading range. For the month of October, the major market indexes finished with a solid average gain of +9.67% with the Dow Industrials seeing it's best percentage gain for the month of October in history as it finished up by +13.95%. This was also the best percentage gain of any month for the Dow since January 1976.
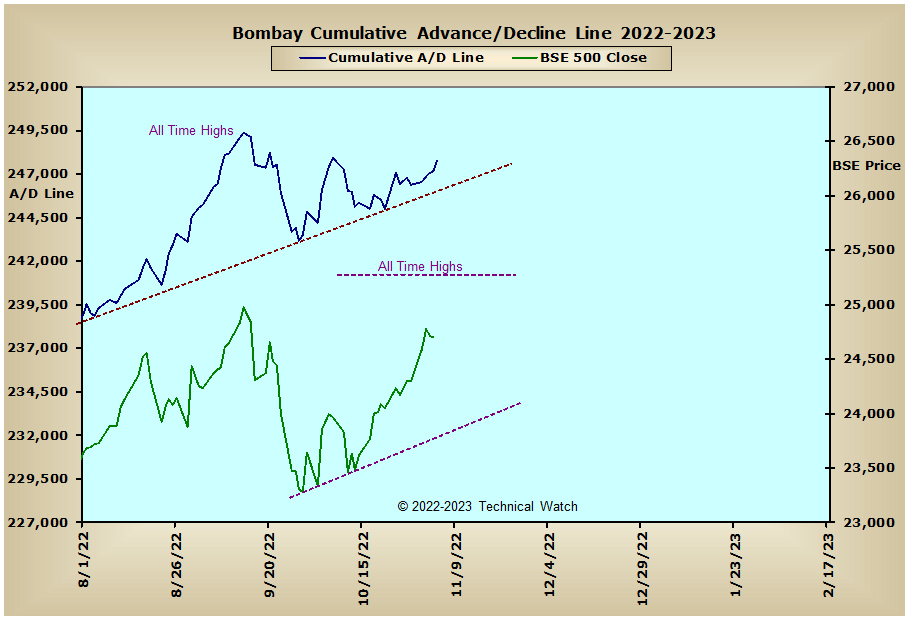
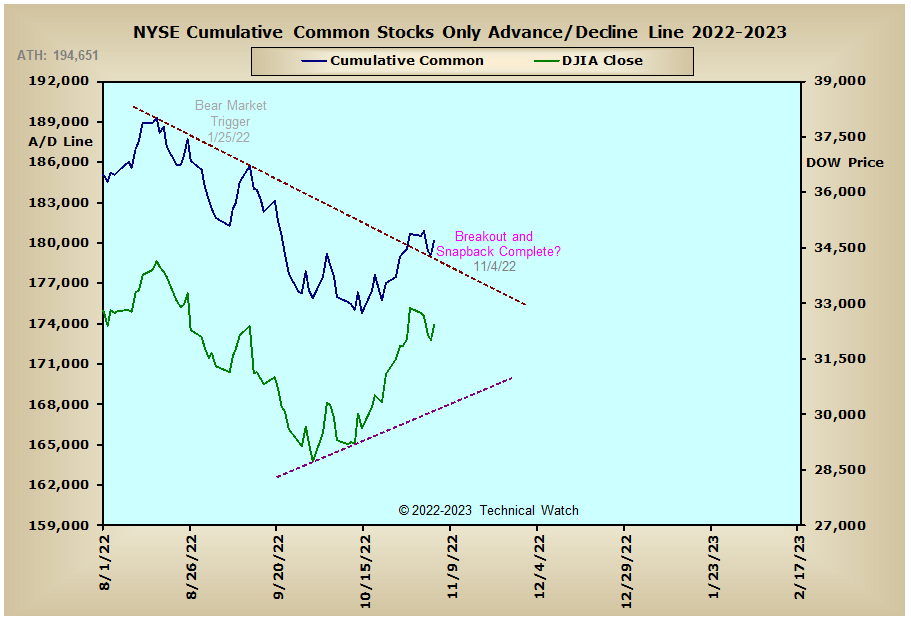
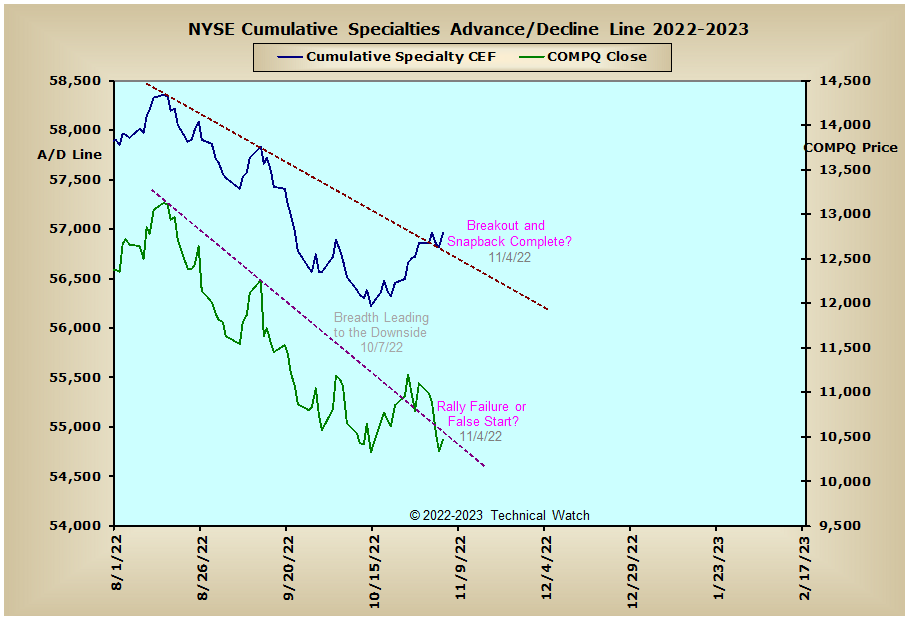
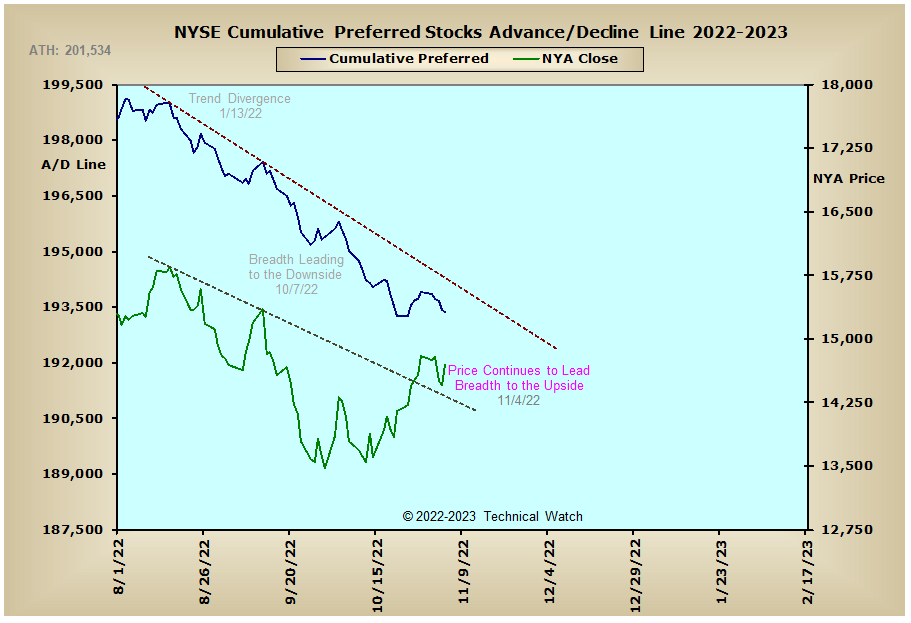
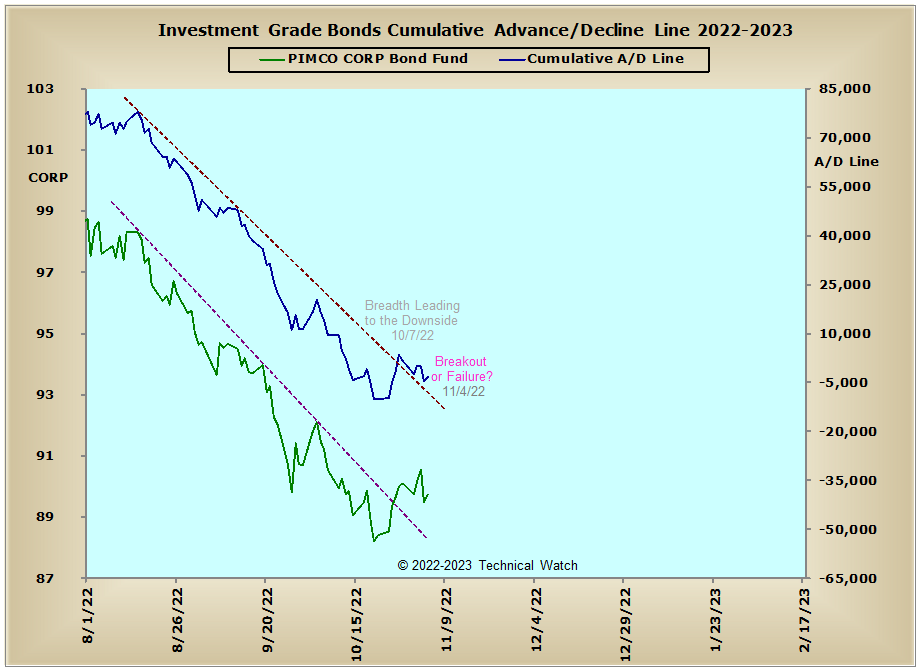
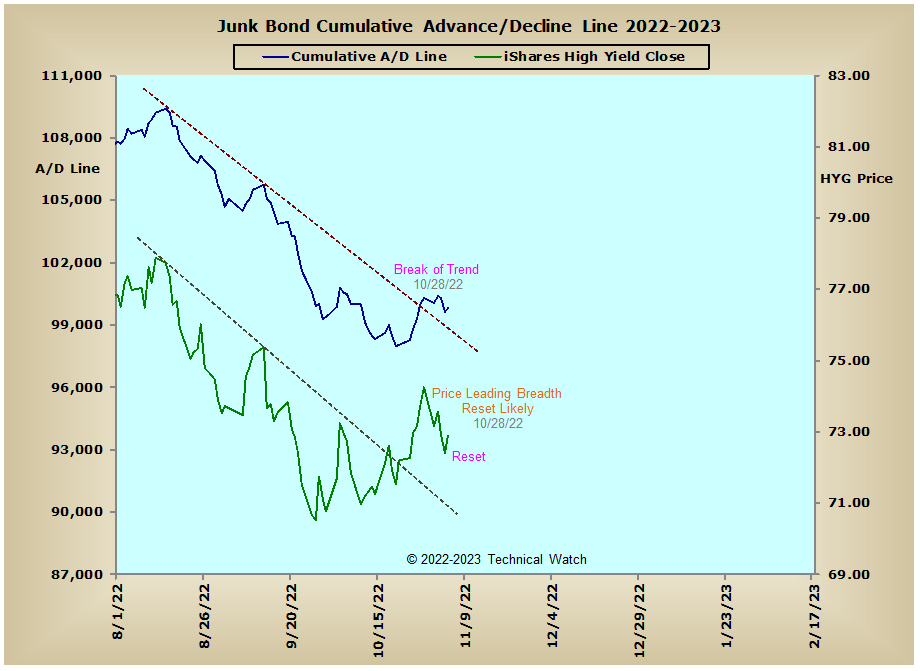
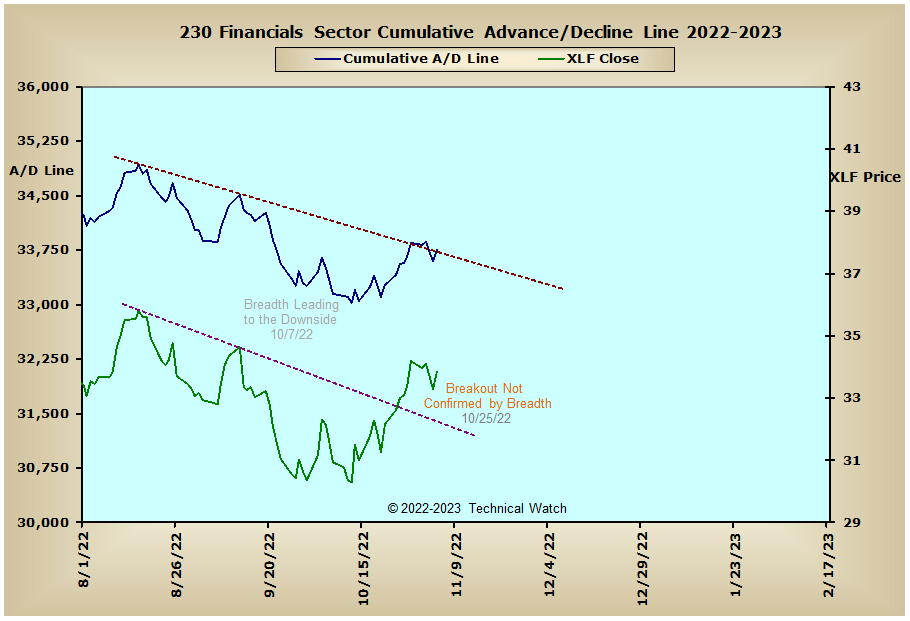
Looking at this week's edition of our standard array of cumulative breadth charts shows that the NYSE Composite, NYSE Common Only and NYSE Specialty CEF advance/decline lines all broke above their intermediate term lines of tops beneath tops early in the week with Wednesday and Thursday's market weakness providing technical snapbacks to these same lines of previous resistance. More importantly, we saw this same break of trend take place in the NYSE Bond CEF, Investment Grade and Junk Bond advance/decline lines as well, with only the NYSE Preferred Stock advance/decline line remaining under heavy downside pressure. Further breaks above this ongoing selling pressure since the beginning of August was also noted in England's FTSE advance/decline line, with both the CAC and DAX advance/decline lines continuing to trend higher since their low points of October 13th. Other positives include the Energy Sector advance/decline line which is now at its highest levels since January of 2020, the NYSE REIT and Russell "1987" advance/decline lines which broke above their downtrend lines at the end of October, while India's BSE advance/decline line needs only 1558 net advancing issues to move back into new all time high territory. With such a uniformed global recovery, one has to wonder if this is sustainable with the likelihood of further interest rate increases coming over the next several months - or - are markets looking a bit further down the road that a more neutral monetary policy stance is forthcoming just after that?? Stay tuned.
So with the BETS losing some steam this week with a reading of -45, traders and investors are back to being a bit more defensive with a bearish bias. Wednesday's stiff pullback in prices broke the multi week series of bottoms above bottoms in all of the breadth and volume McClellan Oscillators though all remain above their zero lines at this time. Exceptions do exist, however, in the NASDAQ volume, NDX volume and Dow volume MCO's which find themselves just below their zero lines even after Friday's technical bounce. The NASDAQ and NDX indexes continue to be the weakest areas of market activity as they keep finding heavy price resistance at their 50 day and 200 week EMA's. Good news for the buyers remains with both the NYSE (1.09) and NASDAQ (1.17) open 10 TRIN's continuing to suggest an "oversold" market environment, while the 10 day average of CBOE and Equity put/call ratios are finally showing "crash calling" speculative put buying coming in with Wednesday and Thursday's sell off. With current technical conditions still suggesting further price recovery going into mid November's OPEX period, we have this month's WWW event on the 9th, October's CPI data on the 10th, and the first look at November's consumer sentiment on 11th as the only potential dips on this blueprint ahead. Using all this as a guide then, let's continue to look for a choppy, volatile week ahead as money sloshes back and forth between sectors and market opinions, while watching tools like the McClellan Summation Index as to whether there's been enough underlying strength to carry this current bounce into the month of December.
Have a great trading week!
US Equity Markets: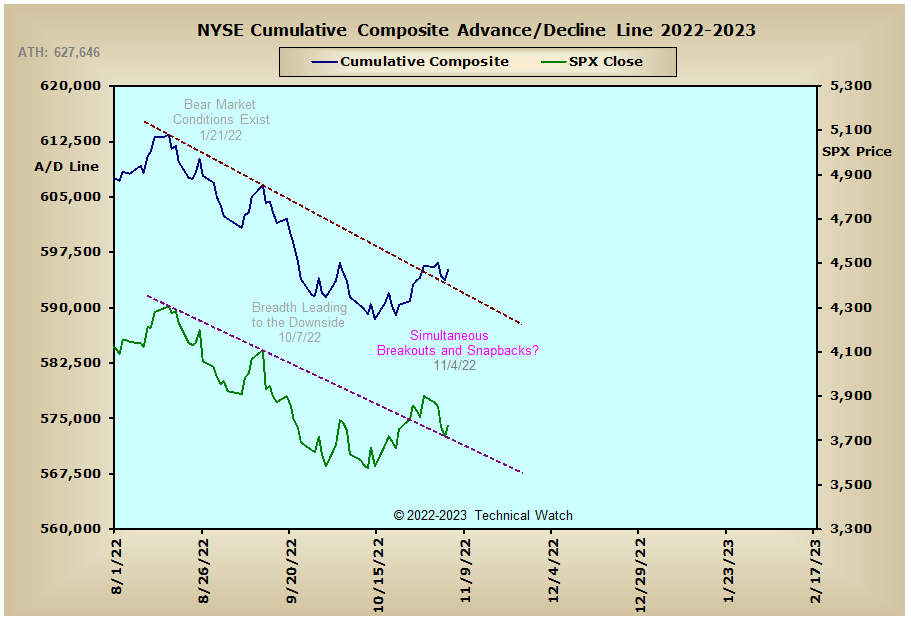

US Interest Rates: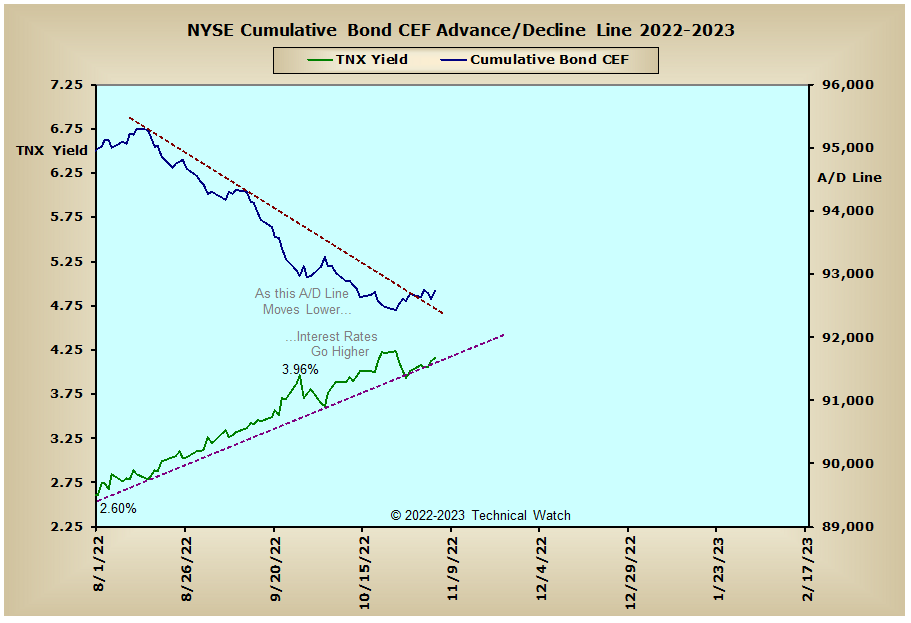
US Sectors: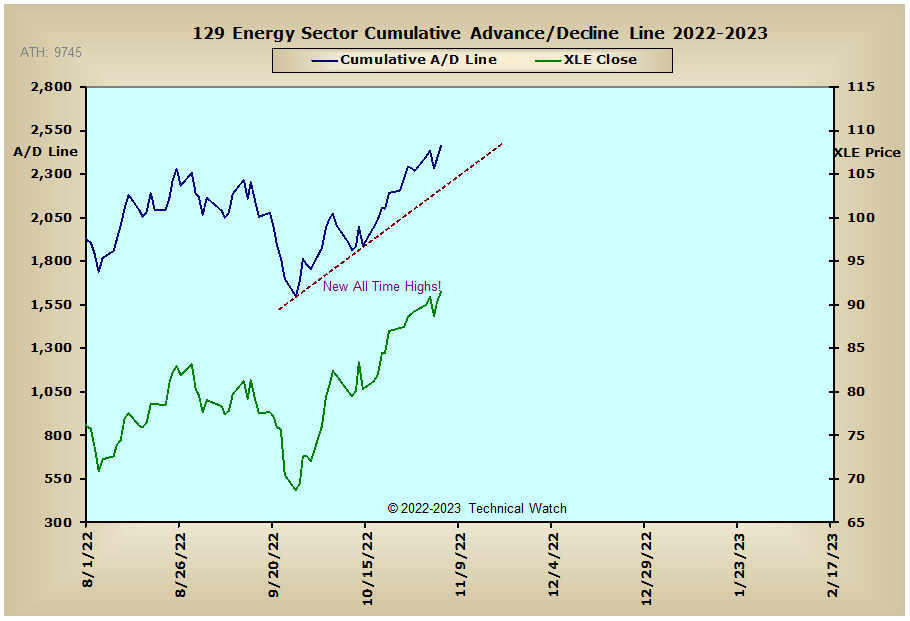

Precious Metals:
Australia: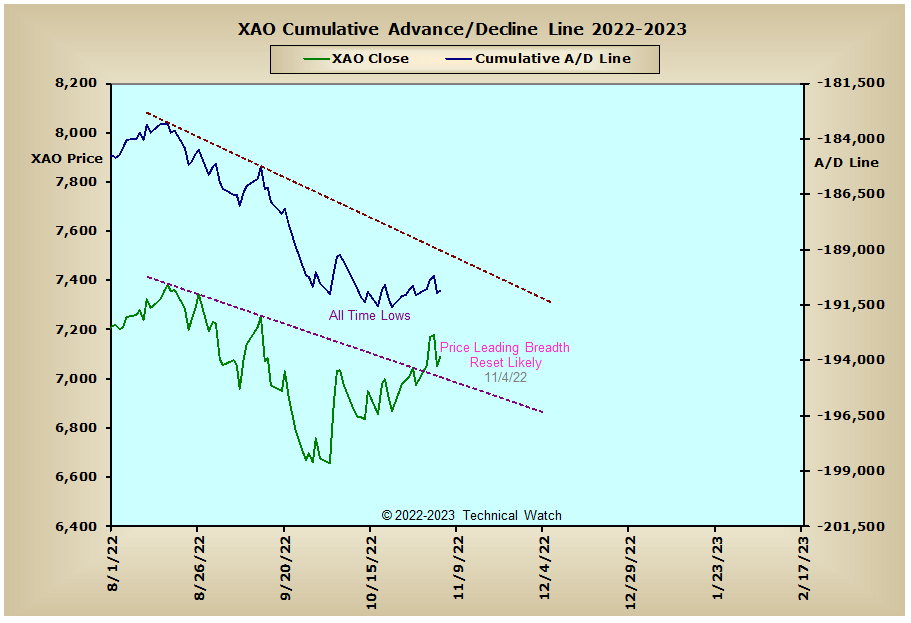
England: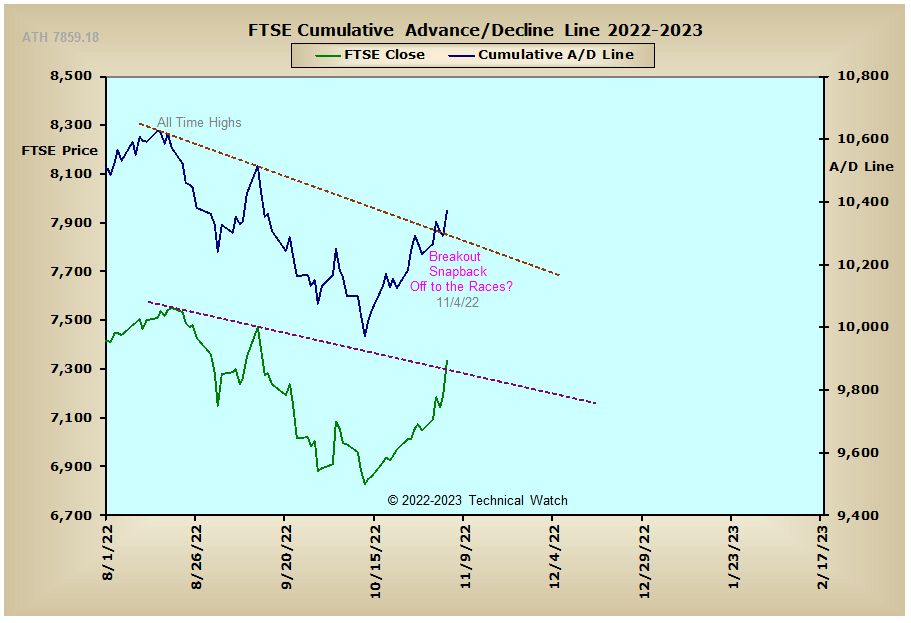
France: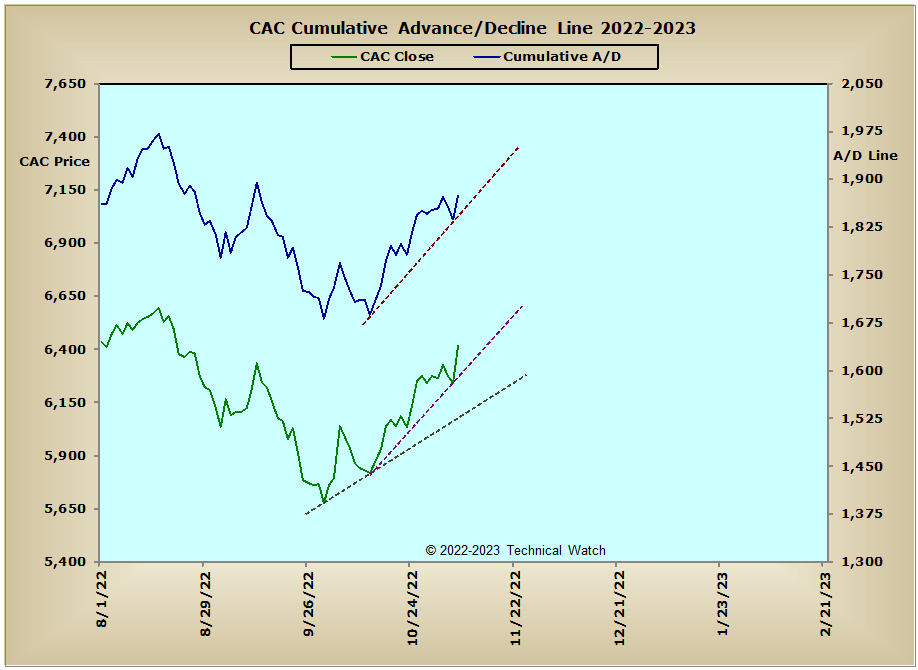
Germany: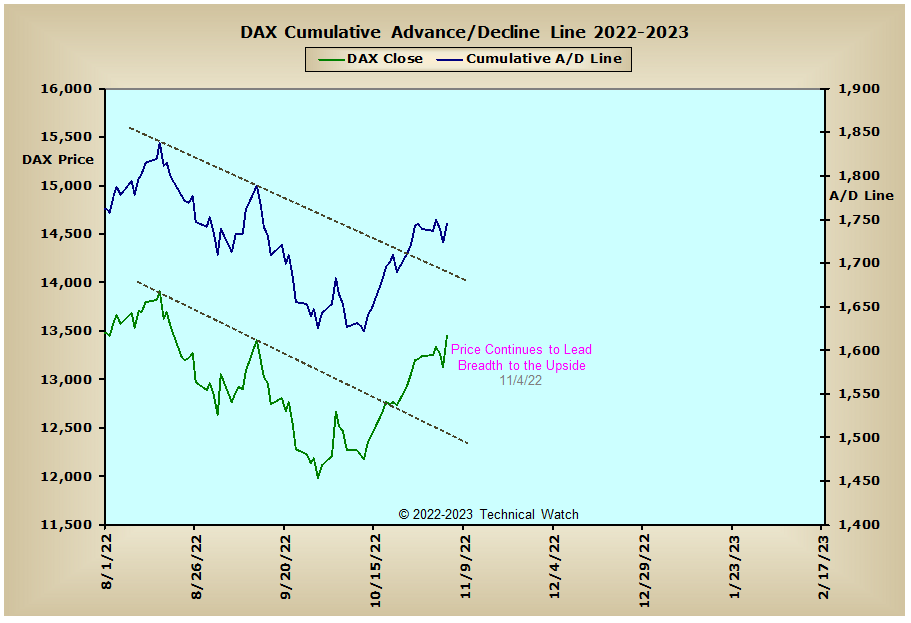
India: