
Partial Quote from the Previous Week:
With the great majority of breadth McClellan Oscillators finishing in and around their zero lines on Friday, and the volume MCO's rather mixed, we should expect a bit of stumbling out of the block as we start the week ahead as one side attempts to take short term control. The NYSE Open 10 TRIN finished on Friday with a reading of 1.03, so we might see a bearish ambush attempt as we stumble about. The 10 day average of put/call ratios continue to scream "top" as call buying remains at historic levels, however, Wall Street Sentiment readings this past weekend showed 79% bears and only 14% bulls. Taken together, the expectation is for a sell off attempt early in the week, and then finishing the week nearly unchanged.
After stumbling about on Monday and into Tuesday, the major market indices found their footing on Wednesday before collapsing again into the end of the week and finishing with an average loss of -2.30%, with the NASDAQ Composite losing -4.92%, and the S&P 600 Small Cap Index paring its losses to only -.79%. For the month of February itself, the major market indices finished with a nice average gain of +4.20% with the Mid Caps (+6.67%) and Small Caps (+7.56%) leading the advance as they have both been doing since the COVID-19 crash lows of last March...finishing higher in 10 of the last 11 months.
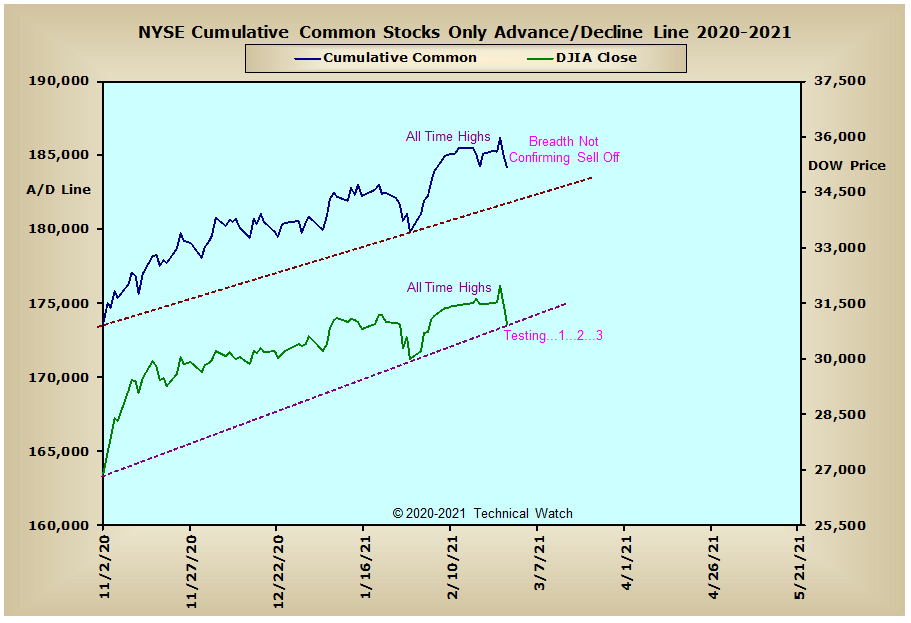
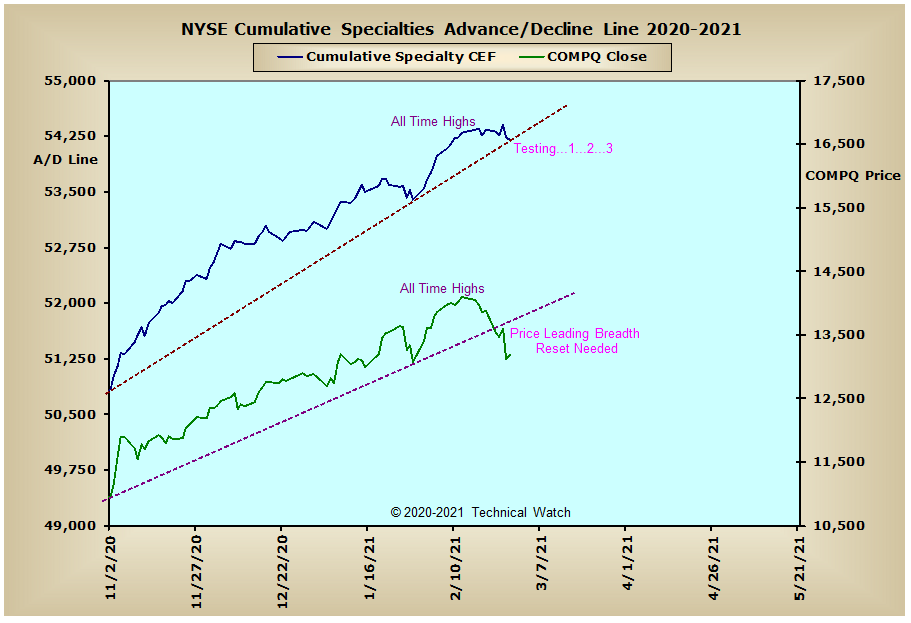
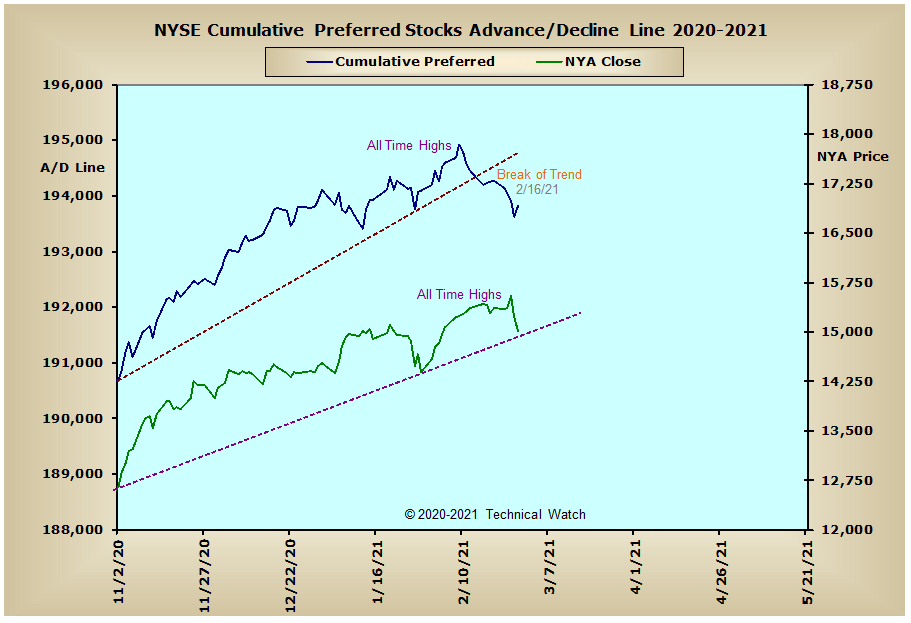
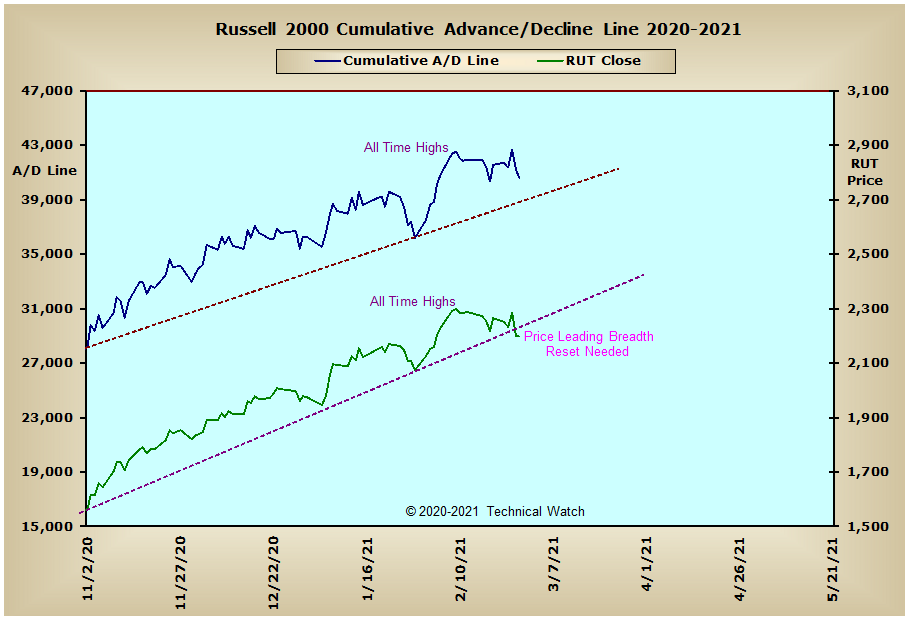
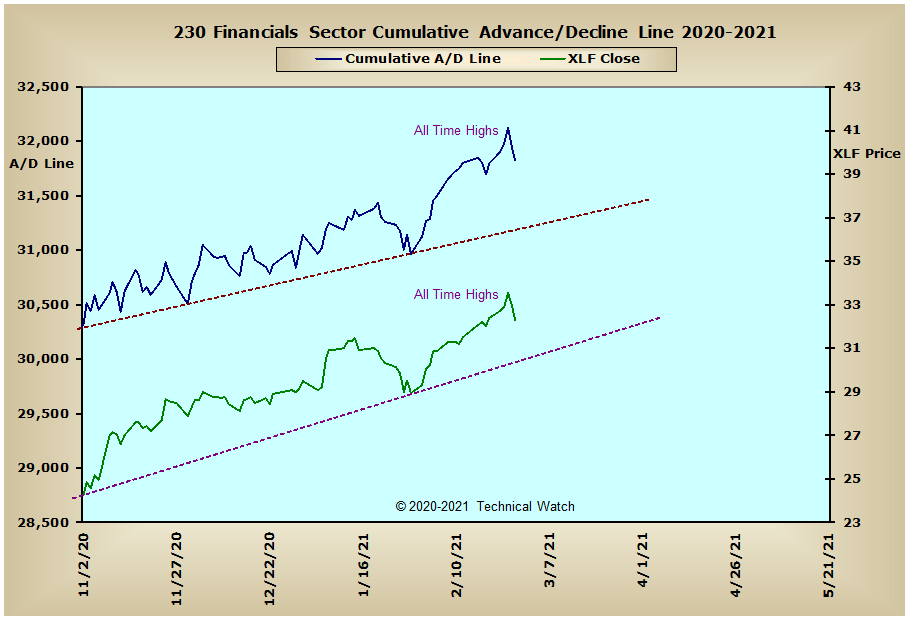
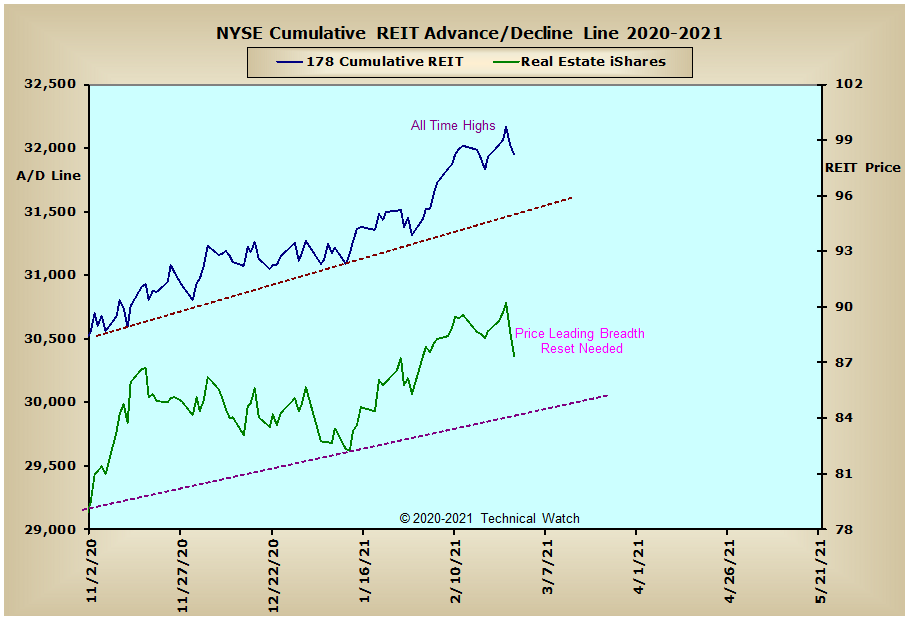
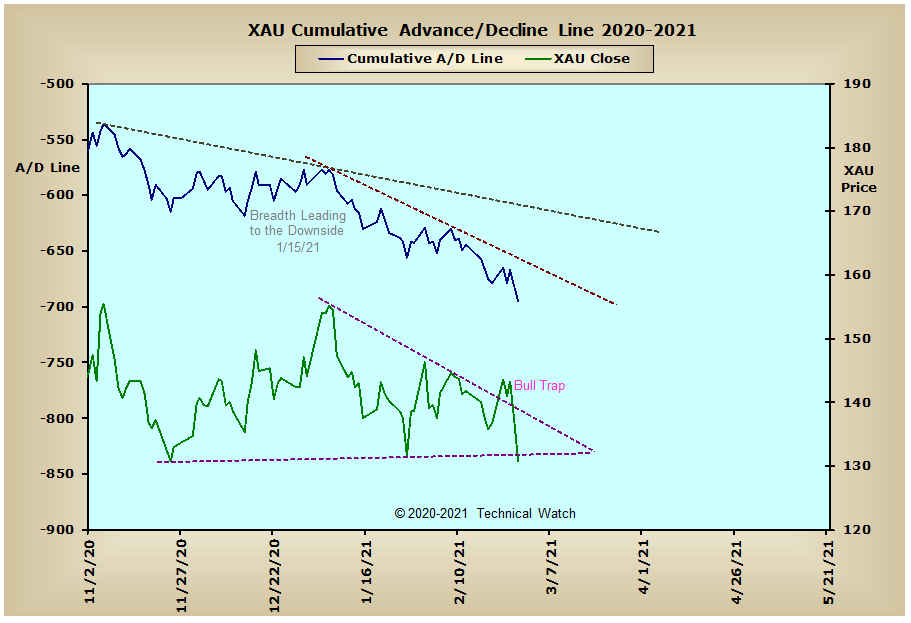
Looking over our standard array of cumulative breadth charts for this week indicates that the NYSE equity related data are now testing their intermediate term rising trendlines with some showing price leading breadth to the downside. This emotional inconsistency in breadth dynamics to price begs for a technical reset to these same patterns as bullish traders excitedly decided to take some well deserved profits off the table. There are some exceptions to this though in the global arena as both Australia's Old Ordinaries and Germany's DAX advance/decline lines have now triggered bearish divergences and are leading prices to the downside. With these areas of international investment losing ground, this is not a good omen for the precious metals and NASDAQ bulls as we go into the month of March.
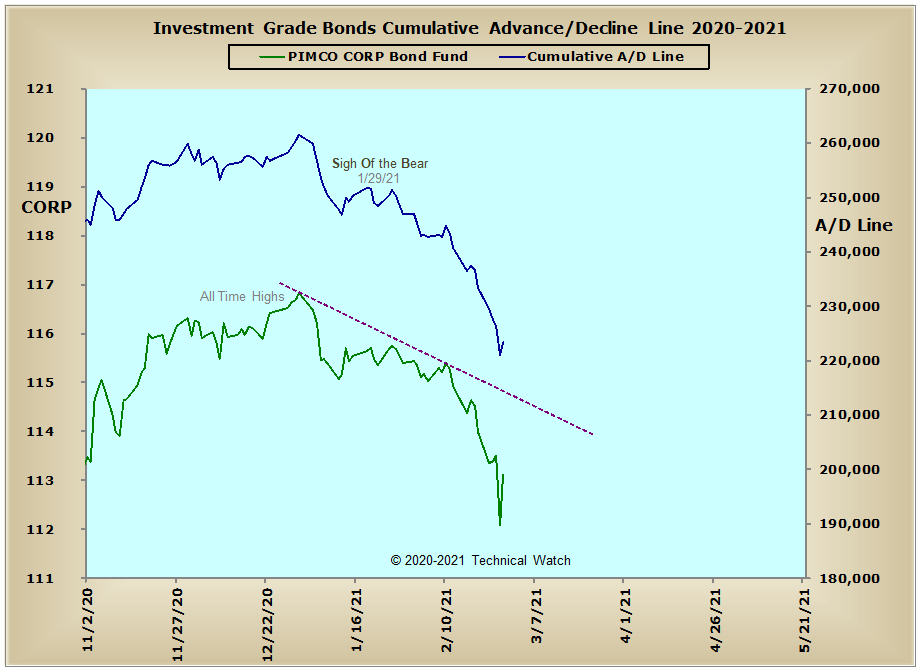
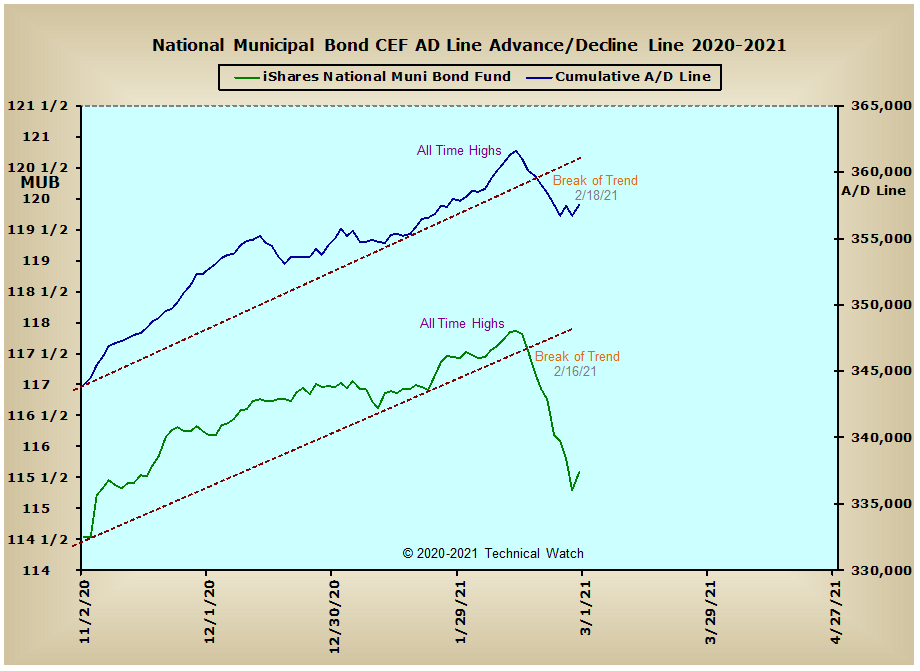
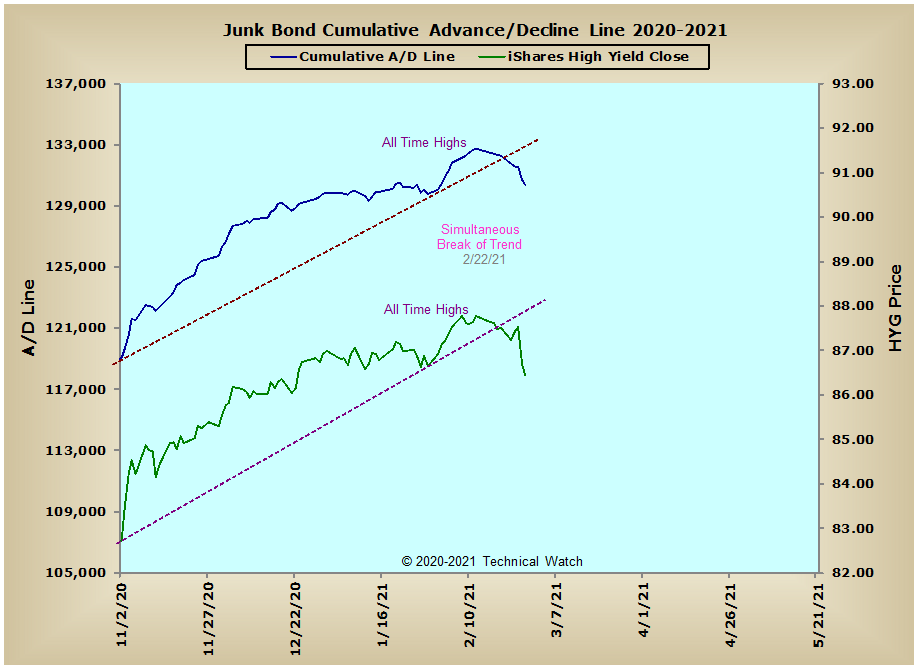
In other areas that need our attention, the interest rate sensitive A/D lines are now succumbing to last month's SOB trigger in the Investment Grade Bond advance/decline line with both the Junk Bond and Municipal Bond advance/decline lines breaking below their multi month advancing trendlines over the last 10 days. With the sell off in these same products looking over extended at this time, like equities, a technical reflex lower in yields would be expected for the week ahead, with the likely completion with next Friday's job's numbers.
Meanwhile, the price of gold finally broke below horizontal support on Friday as it finished at $1728.80. As with nearly all breaks of support, let's look for an initial snapback attempt to or toward the $1770 area to start the week ahead before we see a resumption to the downside with a ultimate price target of around $1550 an ounce...likely to take place in the month of April. One big reason of gold's breakdown on Friday was the strength in the daily U.S. Dollar Index (not shown) as it moved sharply higher...even generating a Parabolic SAR buy signal on above average volume. This, in turn, pushed commodity price baskets sharply lower with both DBC and the CRB triggering SAR sell signals on well above average daily volume. With these same commodity baskets remaining in bullish configurations at this time, it would seem that the Dollar's renewed strength might be only a temporary respite to the longer term bearish trend that we've seen over the last several months. But between now and then, let's look for both commodity baskets (as well as WTIC) and the precious metals asset class to show a negative, if not corrective bias, through the month of March.
So with the BETS finishing with a reading of +40, both traders and investors remain friendly toward the equity markets. With the interest rate sensitive issues now being pawed down, however, it would appear that equities are indeed following the primary script that we've been working with for the last couple of months of a top sometime by mid March. As we begin the week ahead, the breadth and volume McClellan Oscillators are rather mixed with the NASDAQ and NDX indicators both showing a short term selling climax with both price indexes holding at their forecasted downside objectives of initial support. With further short term market weakness expected in the weeks ahead, let's look for intermediate term trading ranges or triangles to develop to allow the various McClellan Summation Indexes to work off their extreme "overbought" conditions...for Elliotticians out there, this would be a corrective 4th wave of 5. This would then allow one more rally phase into possibly the end of the 2nd quarter of this year before any real talk of a change in the longer term trend can be considered. That aside, with last week's sell off generally moving too far and too fast, along with a small point change on the NYSE Composite breadth MCO and a NYSE Open 10 TRIN reading of 1.14 on Friday, let's look for a bullish start for the week ahead that has a pretty good chance of extending into end of the week. What we see after that will likely determine on what we should expect for the rest of the month. With all this knowledge then, let's once again continue to walk the bullish path of least resistance, but also continue to be rather cautious of any divots or ambushes that might be out there without our knowledge, as volatility continues to increase, and we come ever closer to that bearish looking valley that's still ahead of us.
Have a great trading week!
US Equity Markets: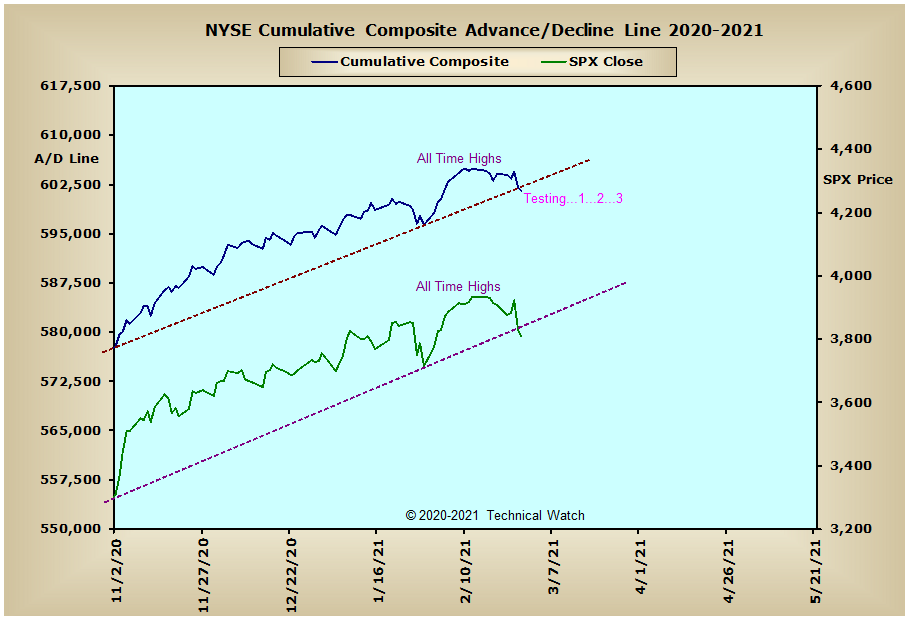
US Interest Rates: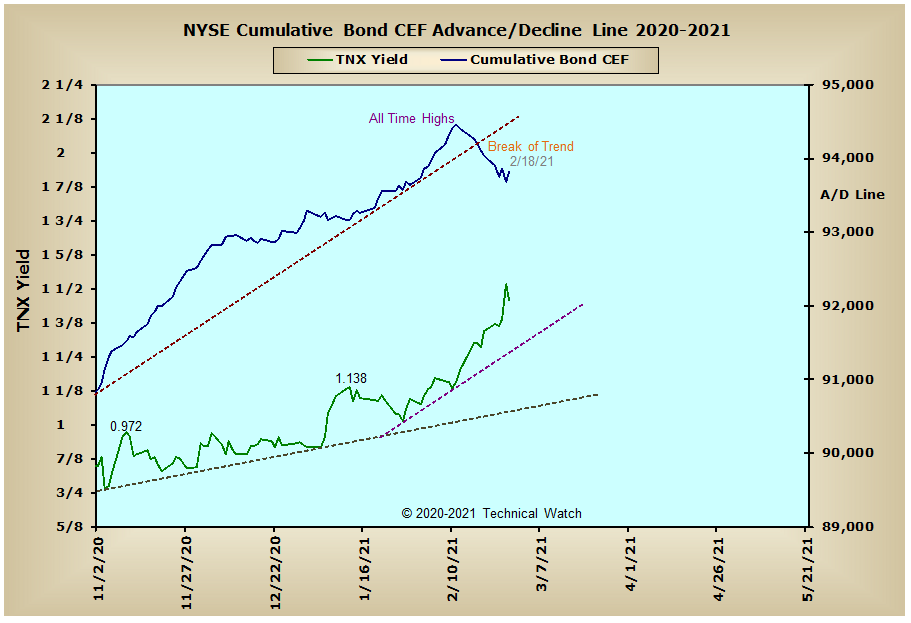
US Sectors:
Precious Metals: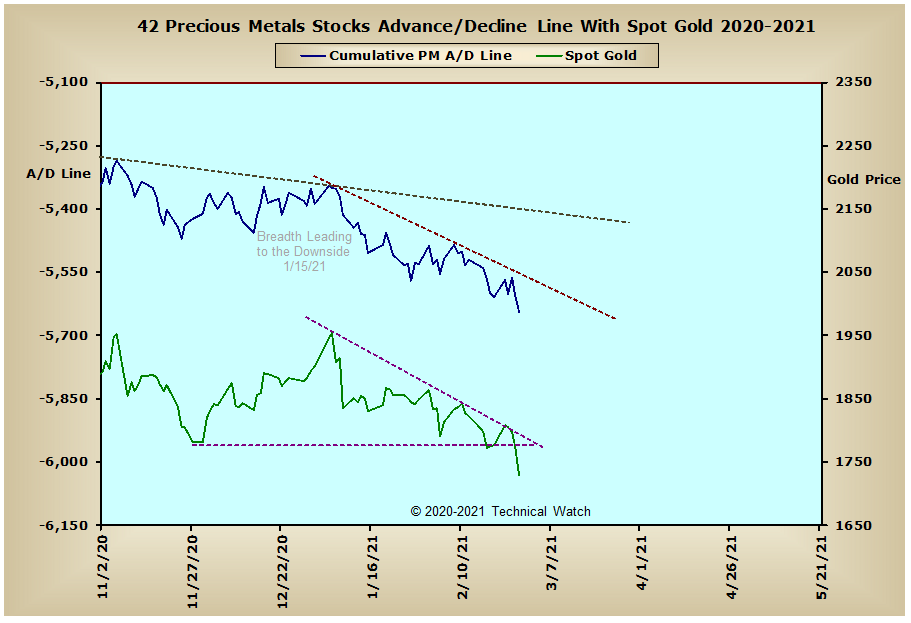
Australia: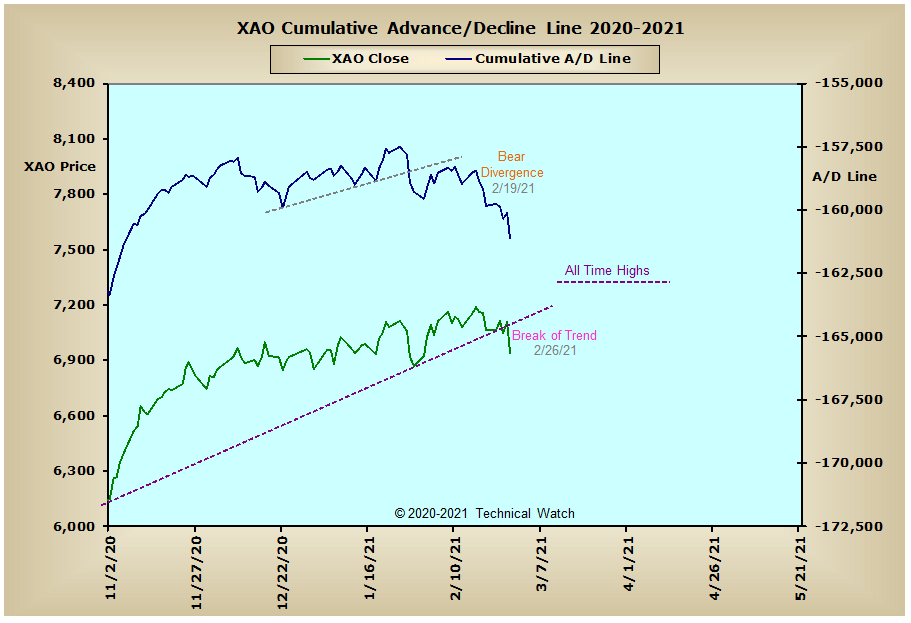
England: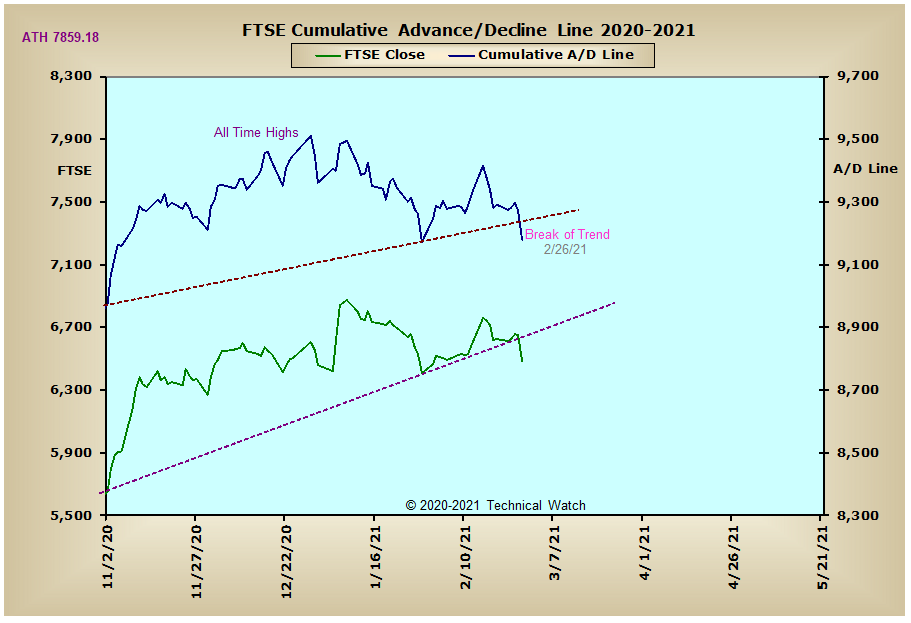
France: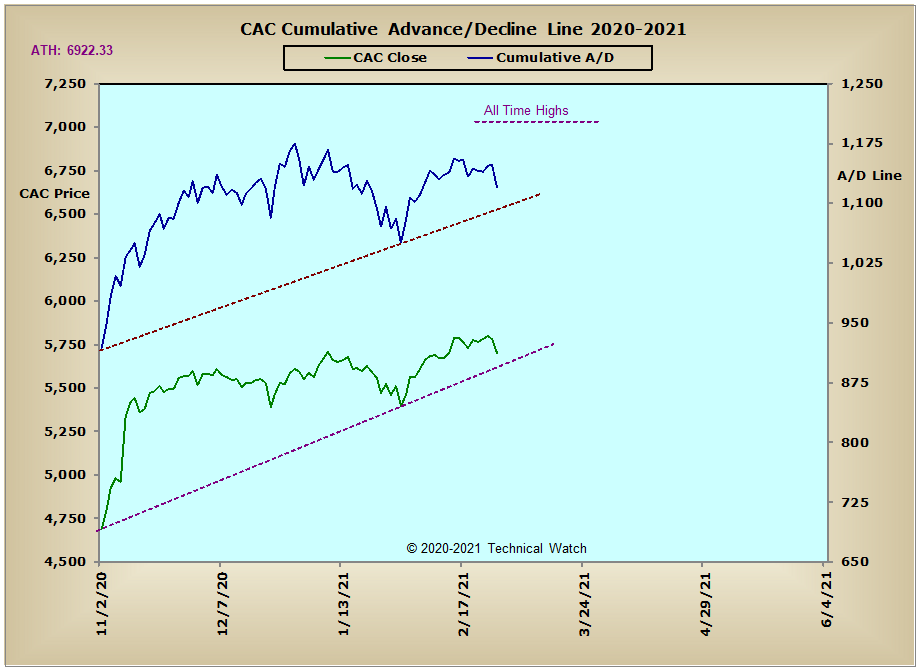
Germany: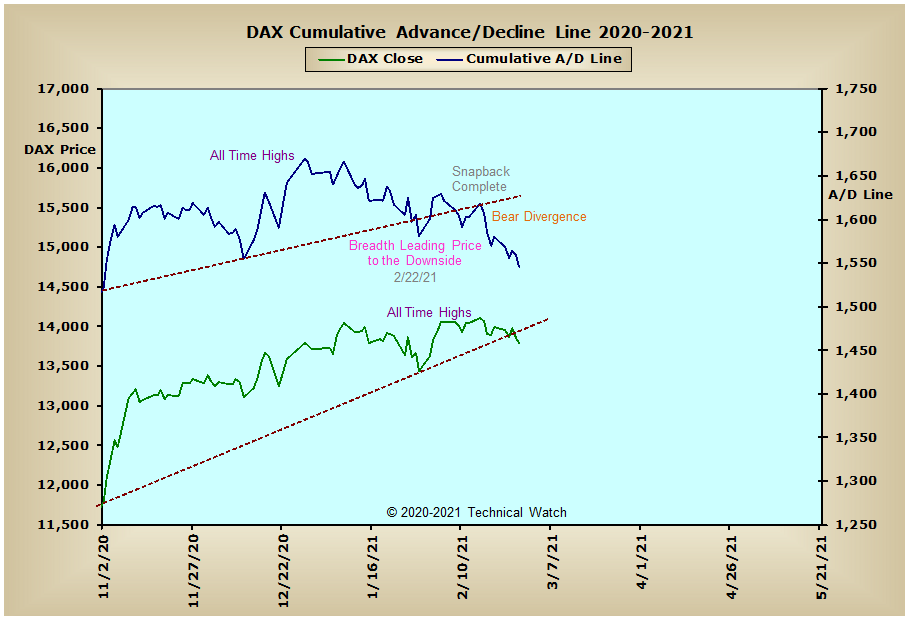
India
Edited by fib_1618, 04 March 2021 - 10:35 AM.


