It turned out to be another week of thrills and chills for market participants as bulls and bears fought hard for short term control, with the majority of price indexes finding resistance, and then consolidating, just under their 200 day exponential moving averages. When all was said and done at Friday's closing bell, the sellers won out with an average weekly loss of -1.63%. For the month of February itself, the bears added to their average loss in January of -5.85% by losing another -2.42% with the S&P 400 Mid Caps (+.99%) and S&P 600 Small Caps (+1.30%) indexes the only areas that finished higher for the month.
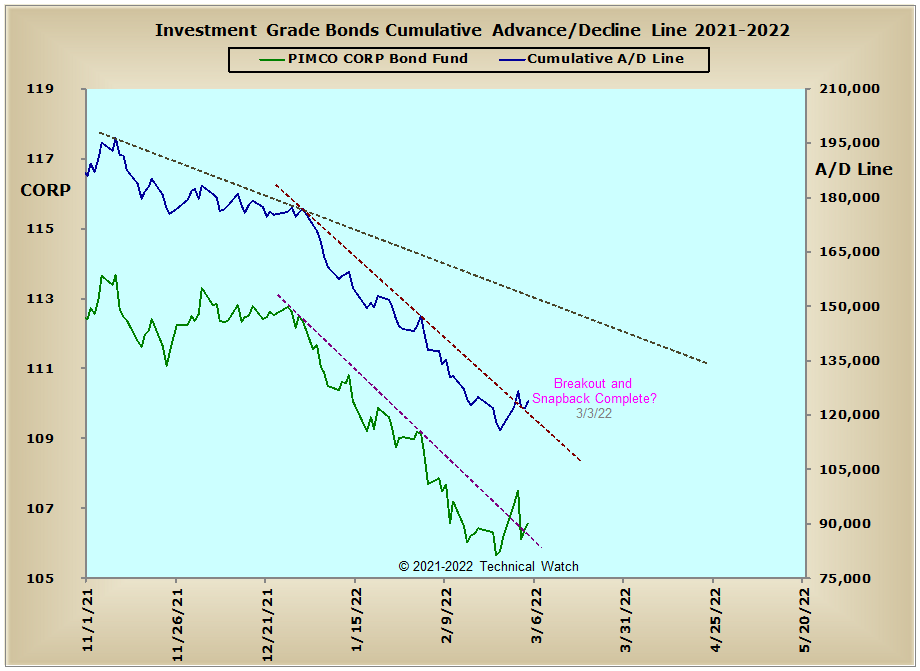
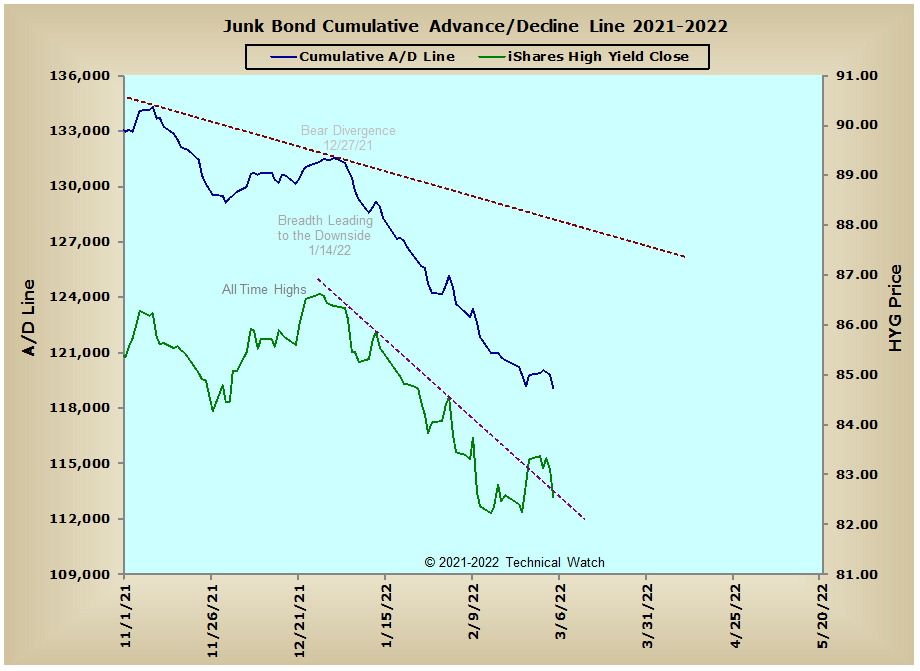
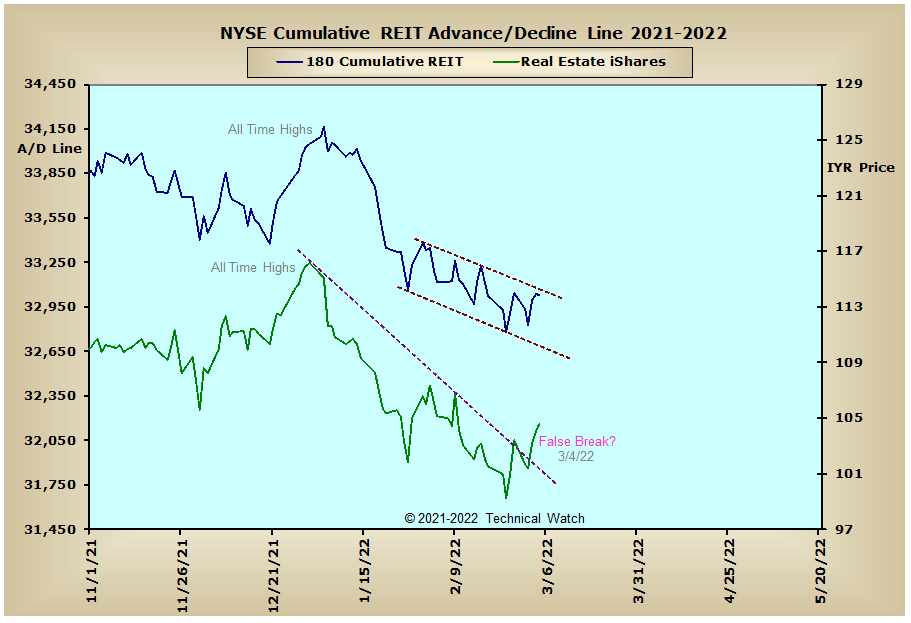
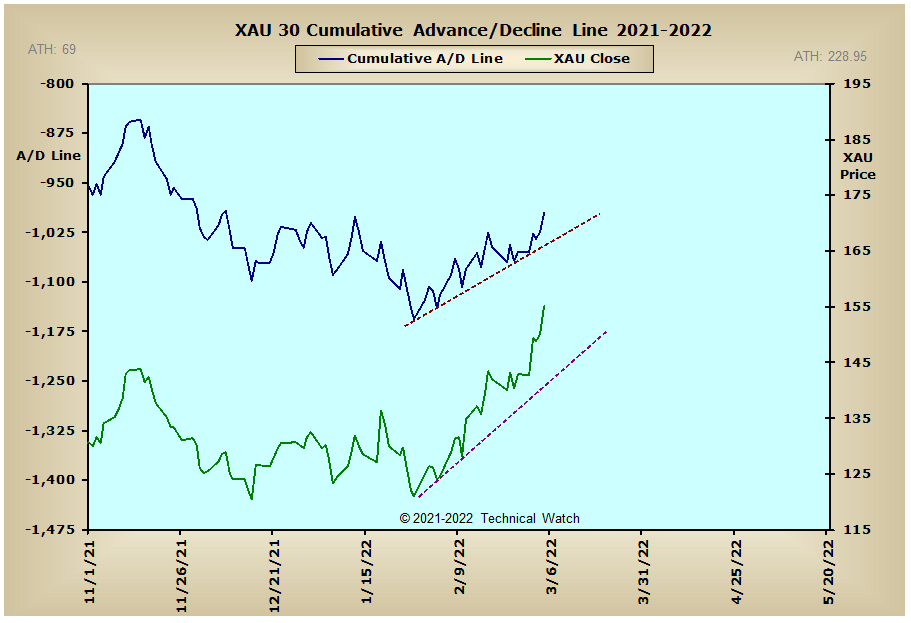
As we look over this week's edition of our cumulative breadth charts, we see there was also very little in the way of analytical changes in the NYSE equity charts from the week before. The big story though is that after fighting the bearish internal trends here in the United States for all of January and half of February, the CAC, DAX and FTSE advance/decline lines all collapsed last week as the war in Eurasia continues to take both its economic and infrastructure tolls on all of the European continent. Other areas of note is that the Energy Sector SPDR ETF (XLE) finished on Friday at new all time highs as West Texas Intermediate Crude ($WTIC) settled the week up $24.09 a barrel or 26.30%. In what can only be called a technical anomaly of the highest scale, these new highs in the XLE also generated "Trend Divergence" when compared with the Energy Sector advance/decline line as it still remains near its lows going back in 2005. This net tally of some 8,411 advancing issues needed to match the all time highs seen back on June 30, 2014, along with the strong "backwardation" we're currently seeing in crude oil futures, will eventually have its highly negative influence on prices sometime down the line once clarity of the unknown is provided. Also doing well right now is the precious metals asset class as the price of gold was up $79.00 (+4.19%) for the week, while the price of silver (+7.38%), platinum (+6.35) and copper (+10.09) also participating. Copper, in fact, closed on Friday at its highest level in history at $4.94 per pound. Interestingly enough, all of this inflationary news which suggests higher rates, combined with defensive allocation responses to future economic weaknesses (lower rates), is having a push/pull effect in the interest rate sensitive areas of the marketplace...with the bellwether of market liquidity, the Junk Bond advance/decline line, now at its lowest levels since October of 2020.
So with the BETS pulling back again to a -25 reading, traders and investors remain with a moderate bearish outlook toward equities. As we begin the week ahead, all of the breadth and volume McClellan Oscillators are either at or below their zero lines, with the components that make up the MCO's, along with the various McClellan Summation Indexes, remaining in negative territory. With prices continuing to hold on to their longer term trading range floors of almost a year, any break to the downside from here would be a highly bearish event as we move into the second quarter of 2022. Meanwhile, and amazingly so given the hostilities abroad, last week saw more bets for higher stock prices (calls) than that of short term weakness (puts) according to the 10 day trending average of CBOE and Equity put/call ratios. This, along with this week's Wall Street Sentiment Survey coming in with a lopsided 9% bulls and 55% bears, adds another layer of trading intrigue as to the eventual short term directional breakout in prices is likely to go. With many commodity prices now at or near their all time highs, the week ahead will potentially remain volatile as market players try to sort things out as to what becomes too much for the consumer to afford. Given all this whirlpool of information to work with, let's go ahead and continue to side with the bearish path of least resistance for the week ahead, with the best trading option now for commodities is to stand aside and not chase news driven parabolic pricing.
Have a great trading week!
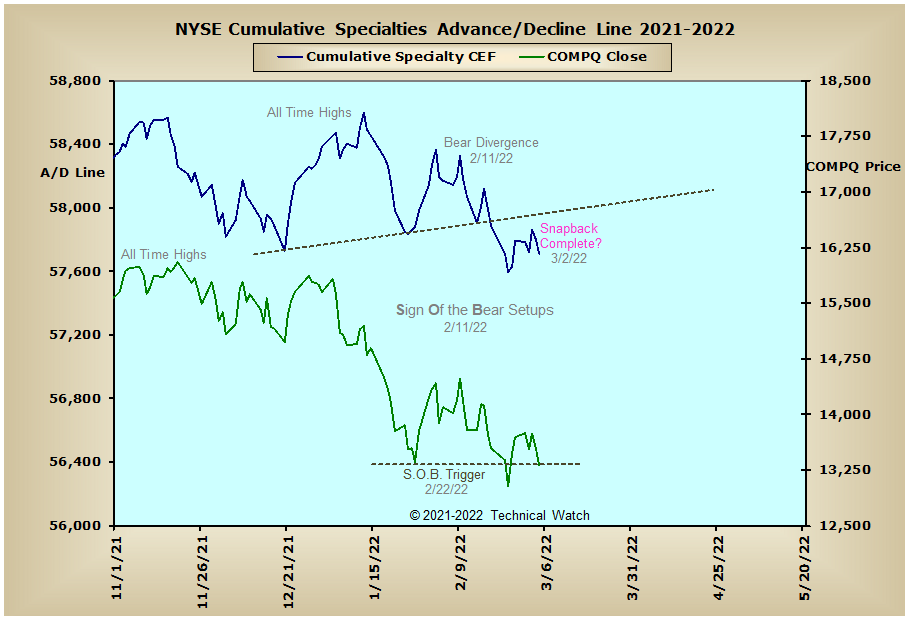
US Equity Markets: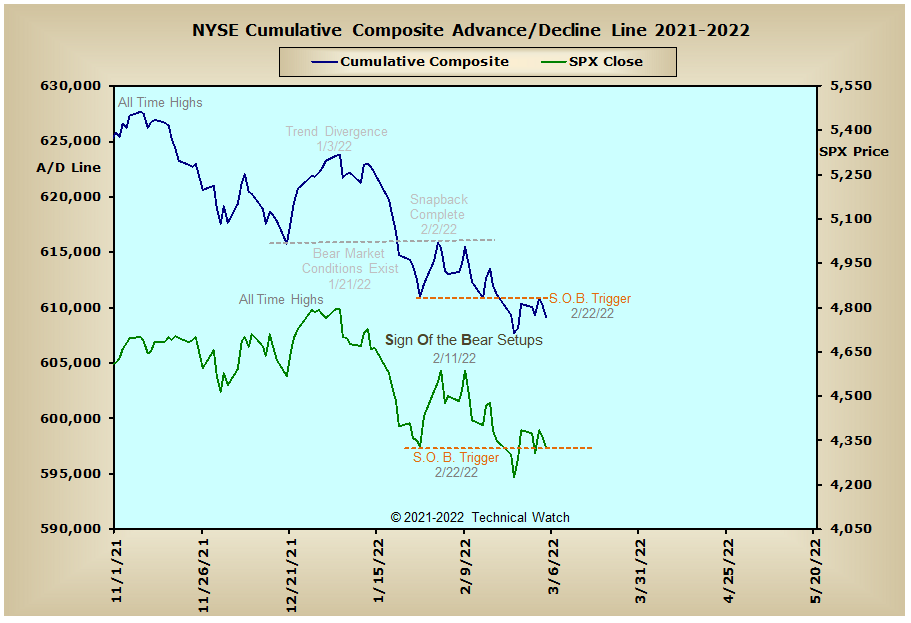

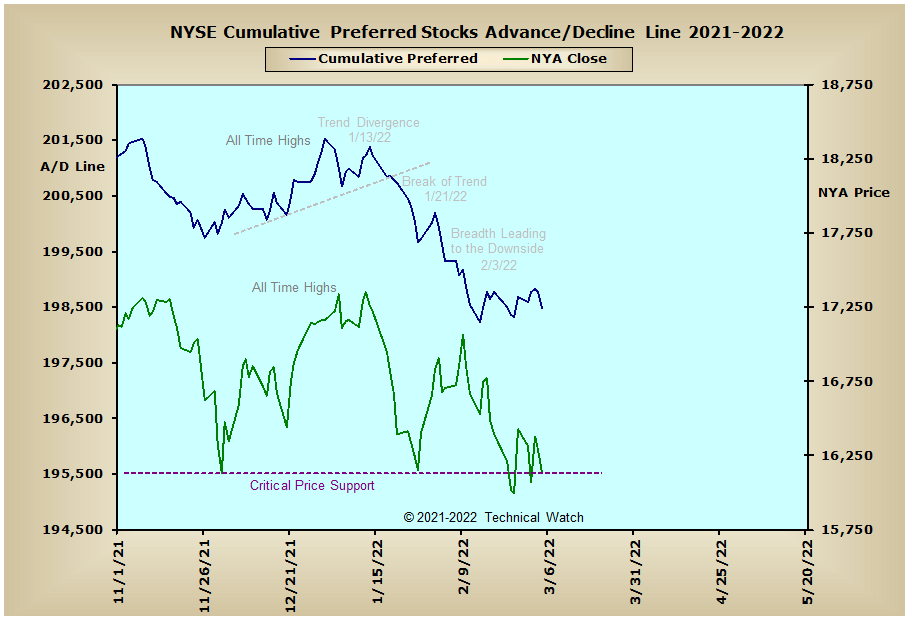

US Interest Rates: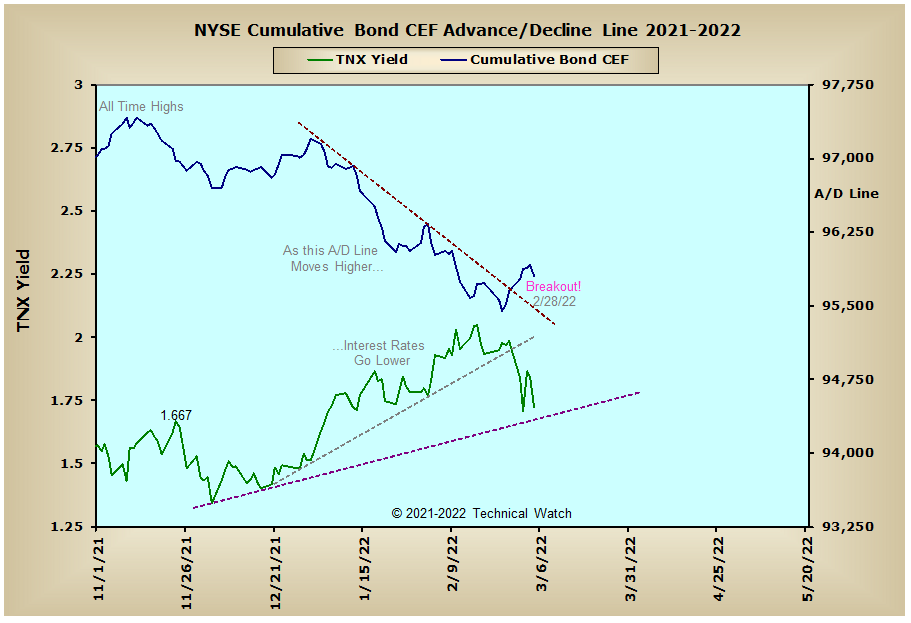

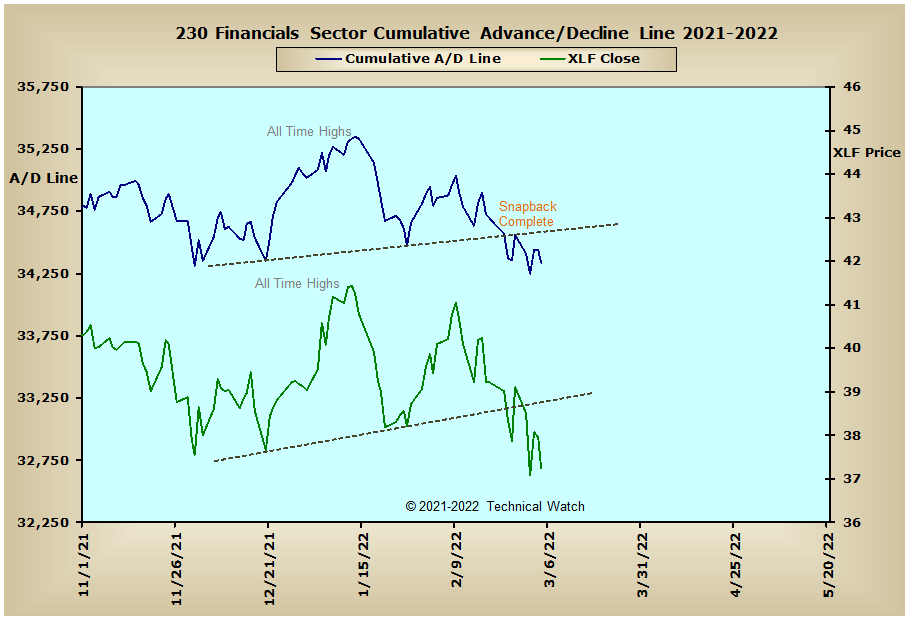
US Sectors: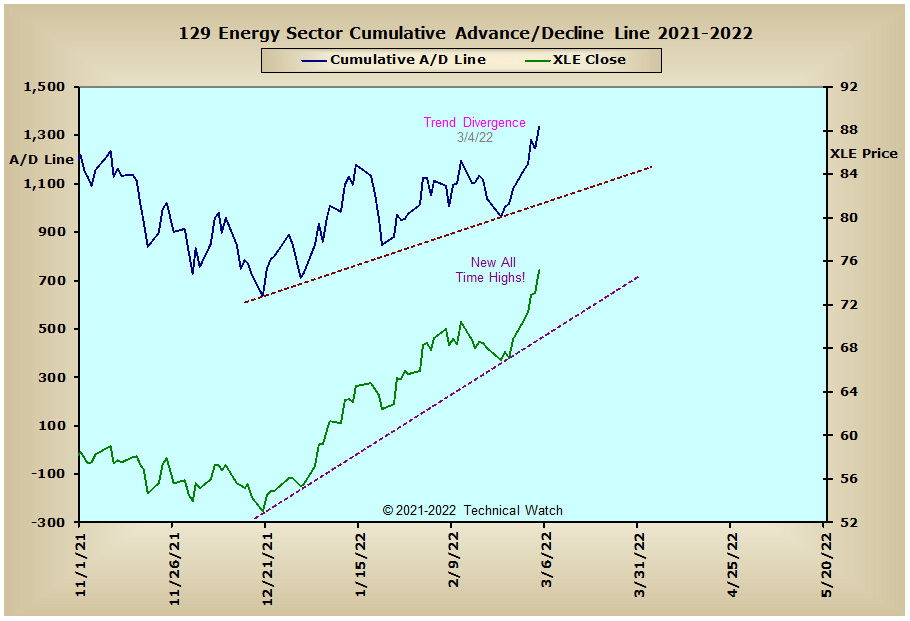
Precious Metals:
Australia: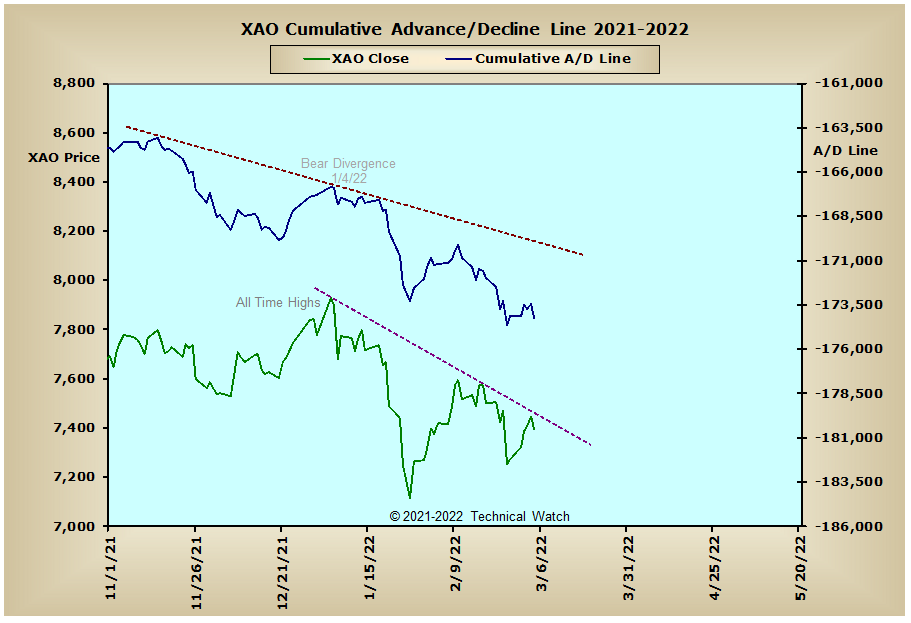
England: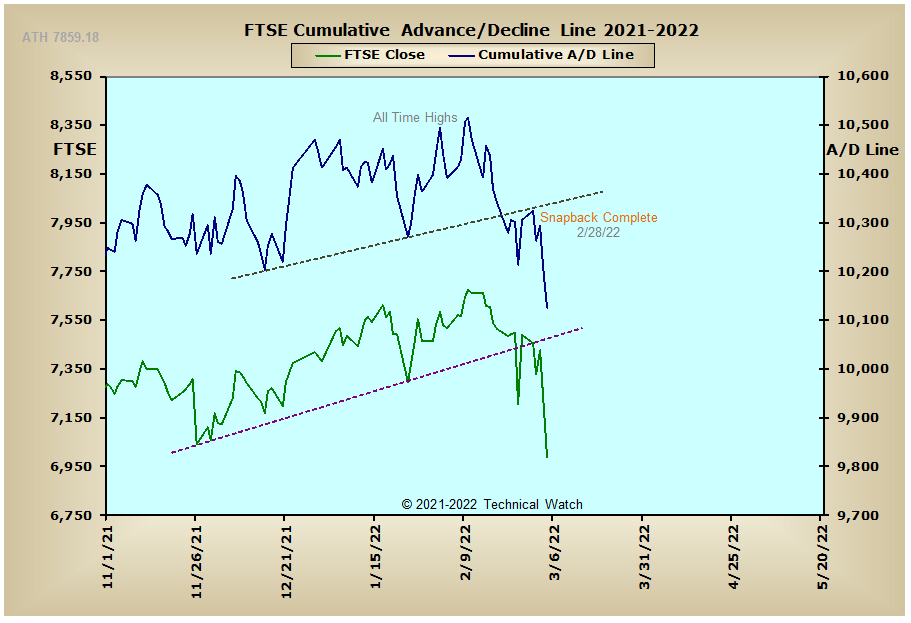
France: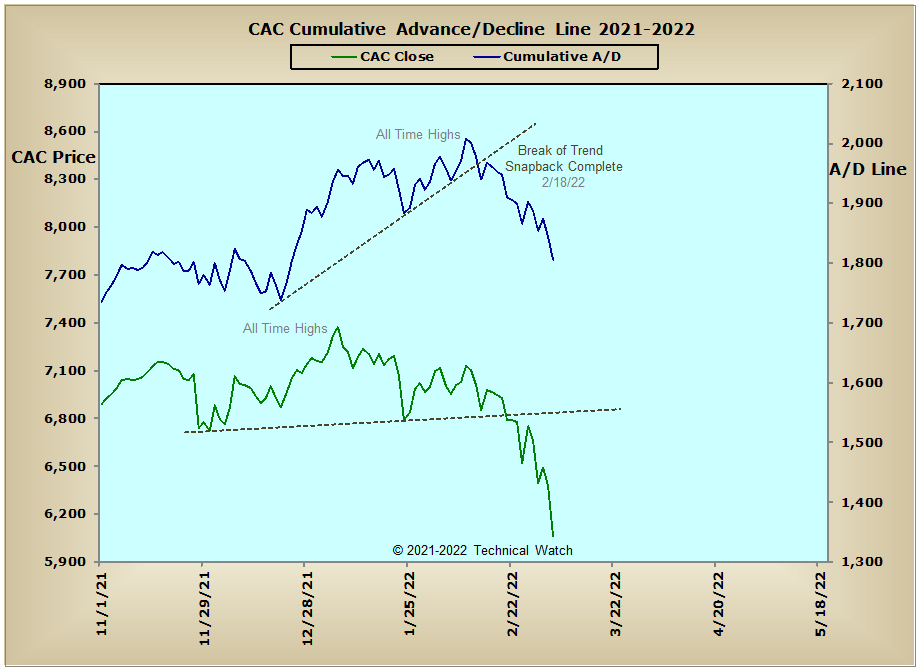
Germany: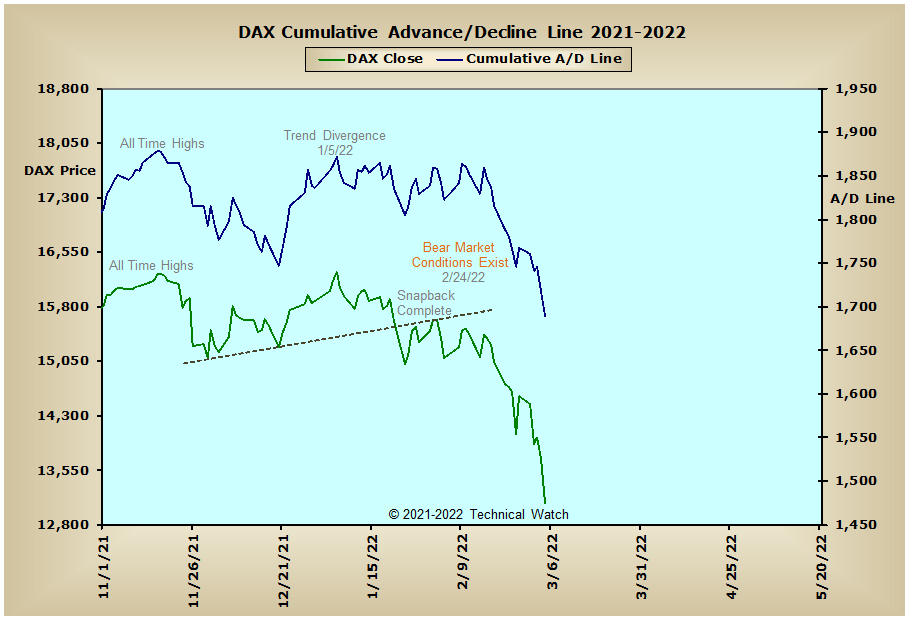
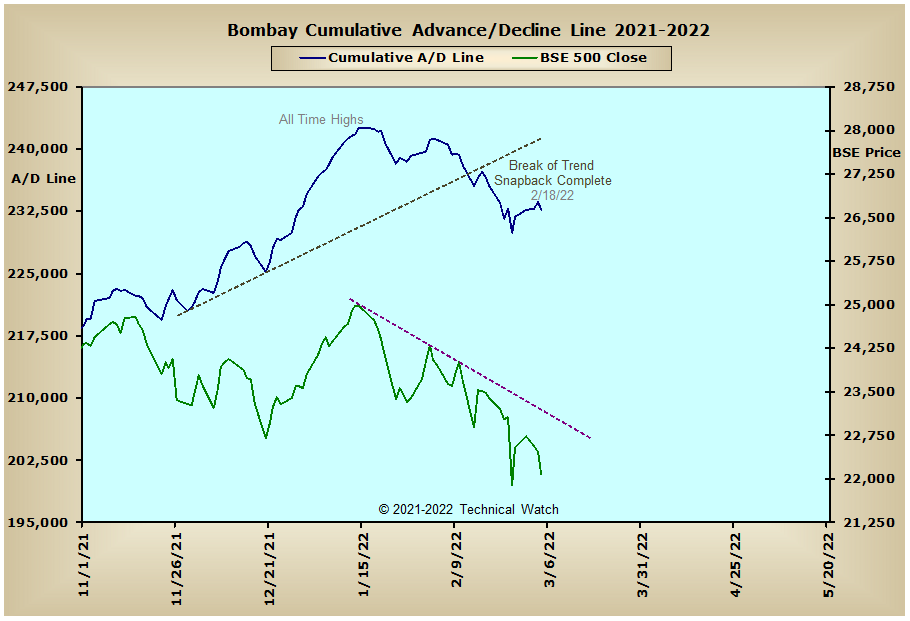
India: