It turned out to be quite a battle between the buyers and sellers last week with the bears taking command in Friday's session as the major market indices finished with an average loss of -3.21%. For the month of April itself, equity markets got walloped with an average loss of -8.06% as the NASDAQ Composite led the pace as it gave back -13.26%. Total combined losses for the year now stands at -13.02%...the worse start to any stock market year going all the way back to 1939.
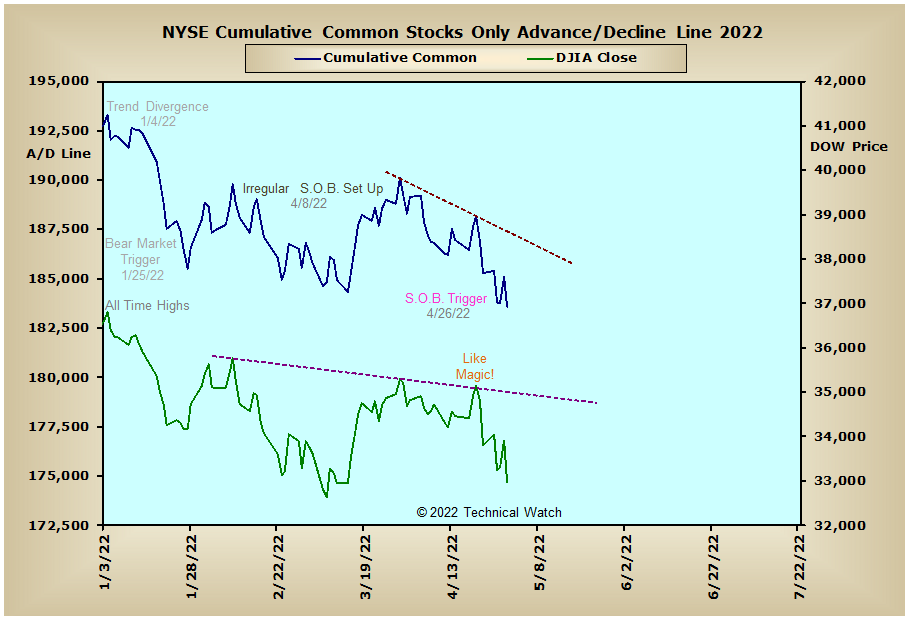
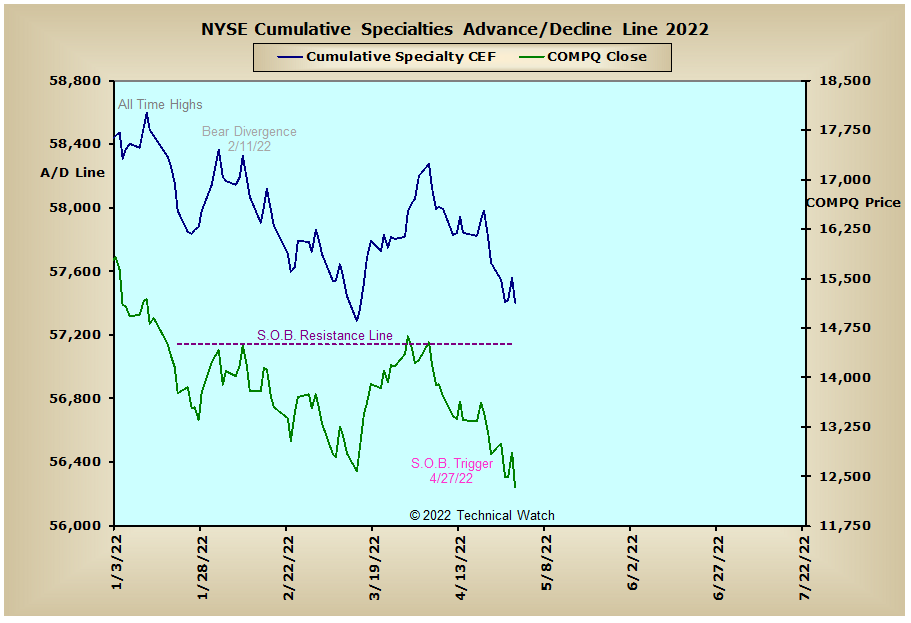
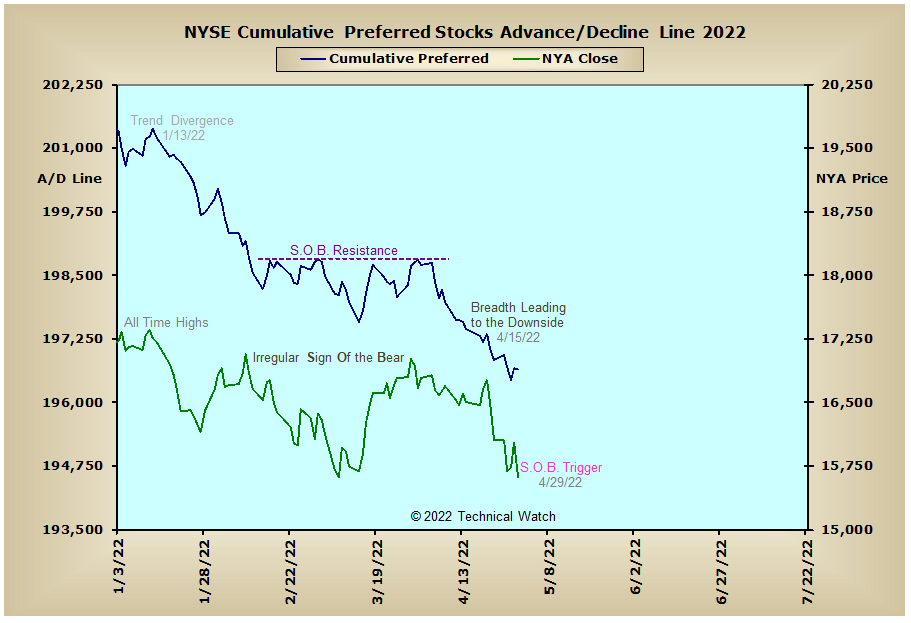
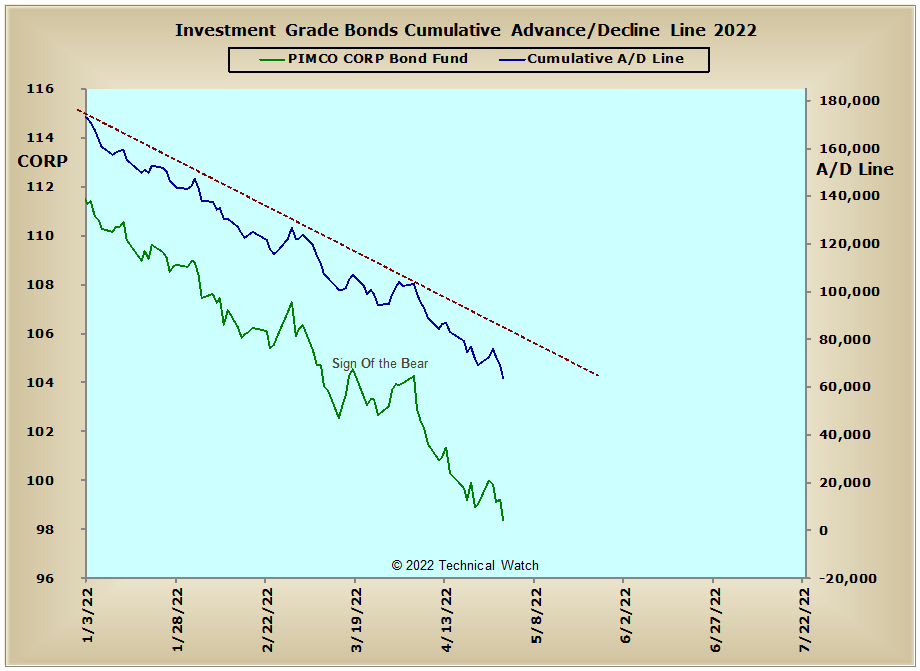
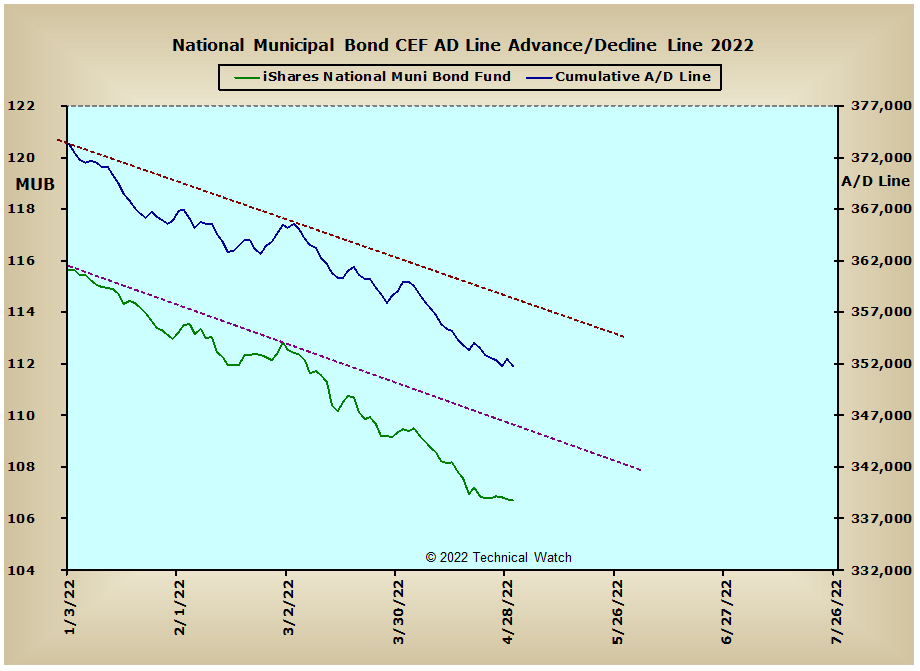
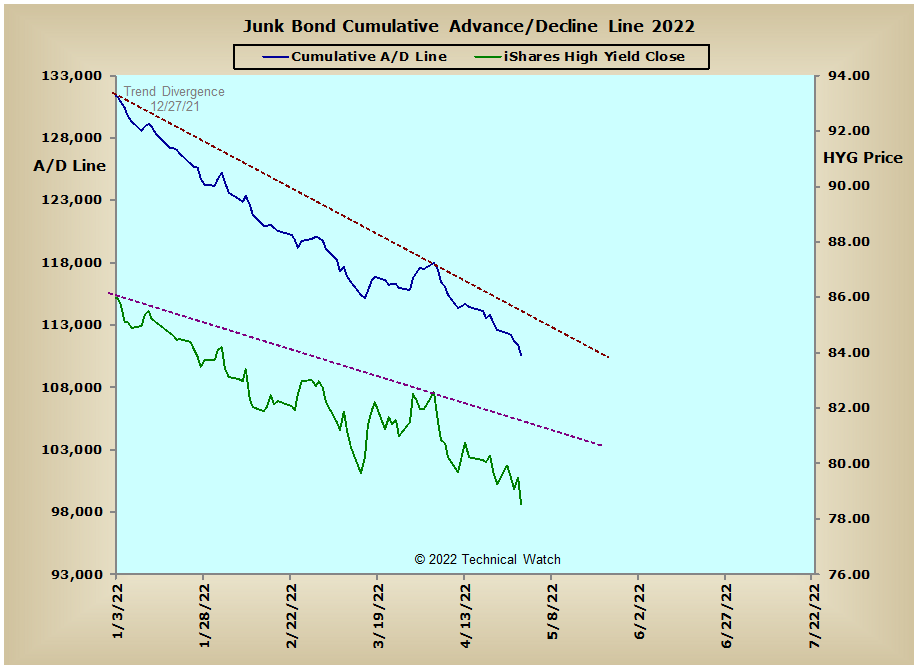
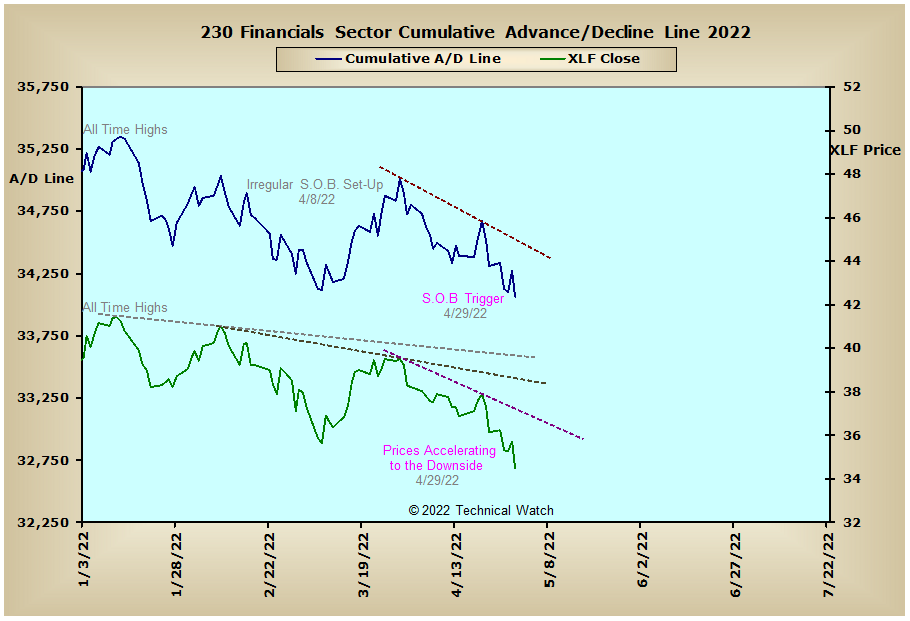
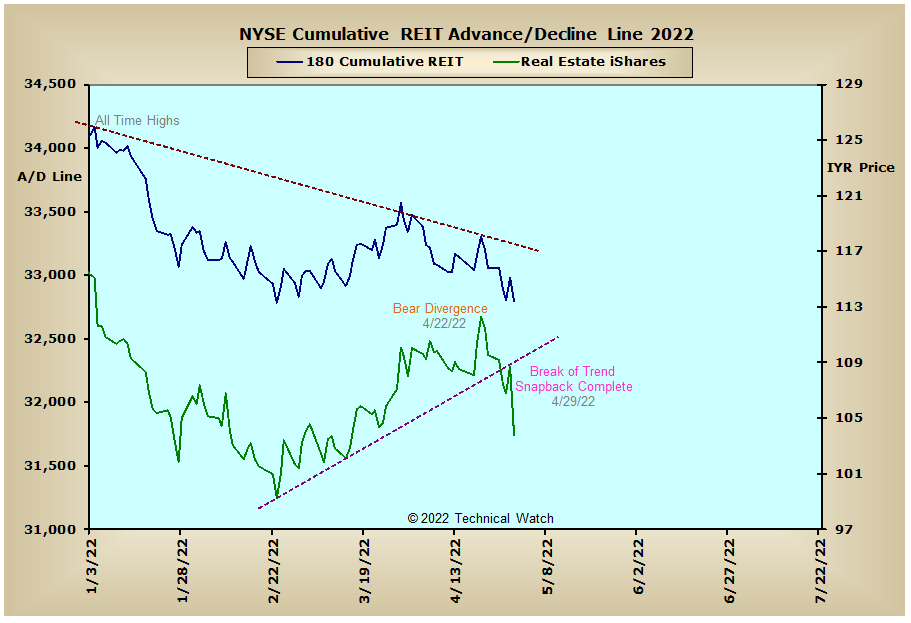
Looking over this week's array of cumulative breadth charts shows that we had several Sign Of the Bear triggers last week including the price charts of the NASDAQ Composite, NASDAQ 100, S&P 500, S&P 100 and the New York Composite Index as the "unyielding" pressure of the interest rate sensitive advance/decline lines continue to sell off in historic fashion. This weakness in the debt asset class also continued to put undo pressure on the Financial Sector, NYSE REIT and the Precious Metals advance/decline lines as the liquidity pool shrinks just as rapidly. Meanwhile, international markets maintained their buoyancy last week as indecisive news continues to come out of the Eurasian region with the exception of the Aussie advance/decline line which maintains its longer term trend to the downside.
So with the BETS matching its lowest levels since the COVID crash of 2020 at -55, investors can continue with their short strategies with more of a bearish bias. As we start the week ahead we'll note that Friday's sell off created bullish divergences with all of the breadth and volume McClellan Oscillators with the sole exception of the OEX volume MCO which matched these comparable lows from April 26th. The NYSE TRIN also got rocked on Friday as it finished with a reading of 2.26 and this drove the NYSE Open 10 indicator into deeply "oversold" territory as it settled at 1.29. Speculative put buying continues to increase significantly at this time, with implied option volatility readings in the mid 30's making these positions fairly expensive. When taking this information together, an opportunity currently exists that another bottom in prices might be seen early in the week, but on the flip side, if this bounce fails to receive any takers, some form of an all out capitulation might then be the result given the very weak cumulative readings in both breadth and volume at this time. With all this as a backdrop then, let's go ahead and still walk the bearish path of least resistance to start off the month, with any breadth plurality readings of more than 6:1 to the good suggesting more of a price consolidation is to be expected as we go into May's OPEX period which is due on the 20th.
Have a great trading week!
US Equity Markets: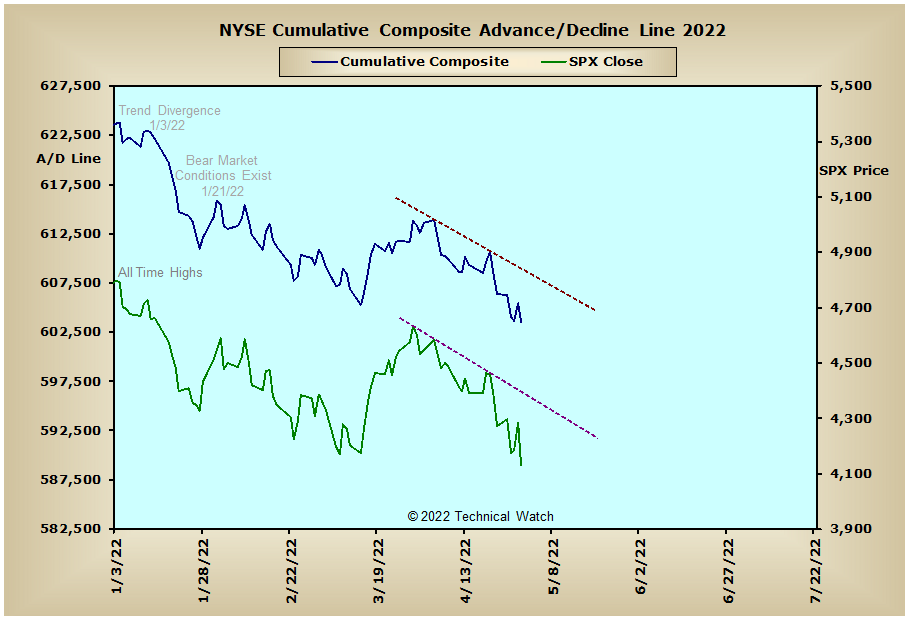

US Interest Rates:
US Sectors: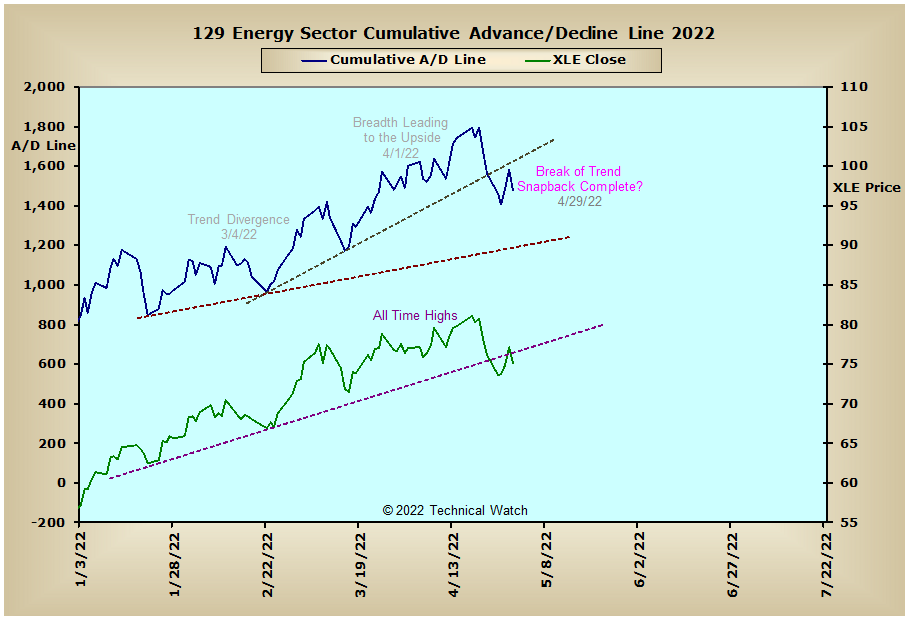
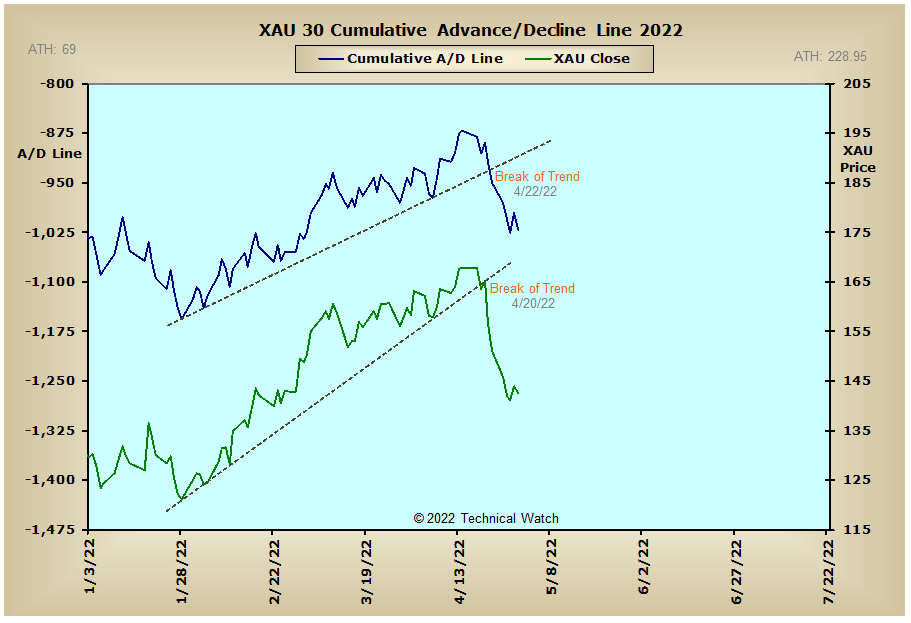
Precious Metals: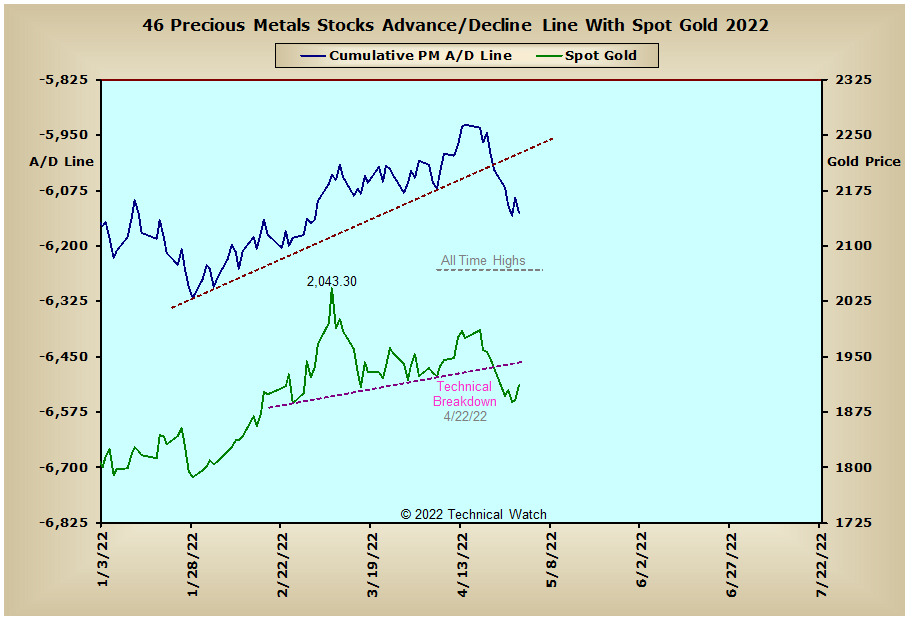
Australia: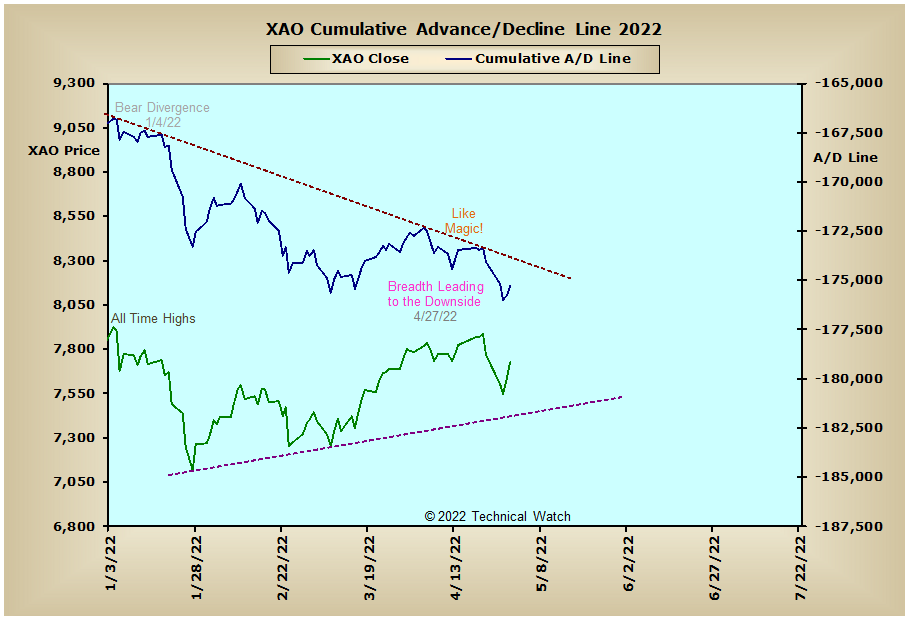
England: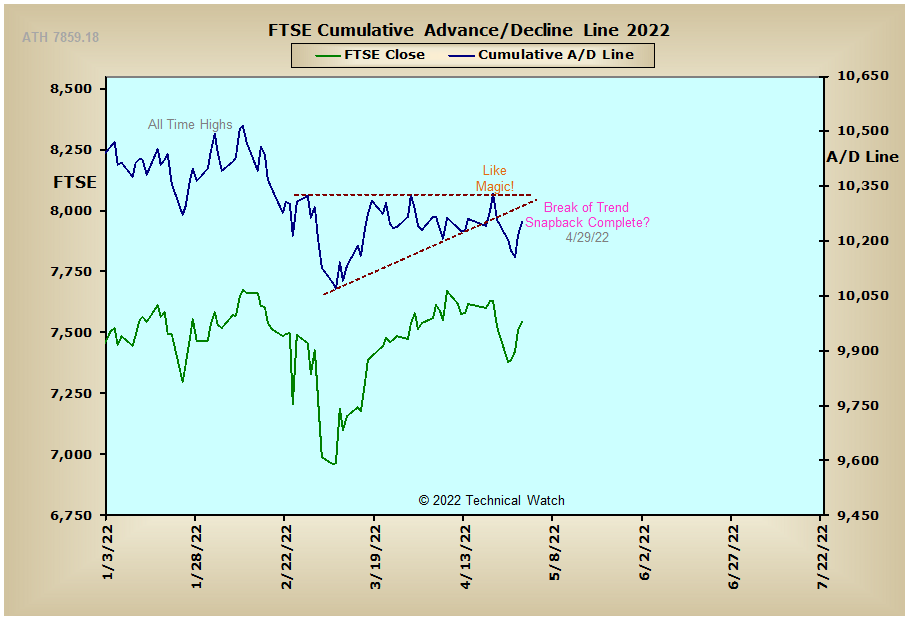
France: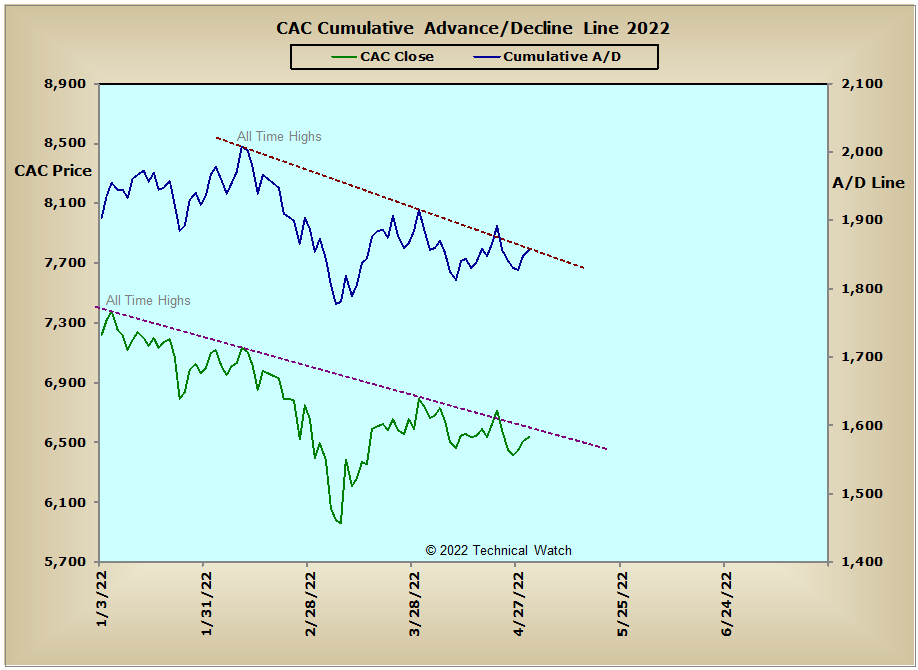
Germany: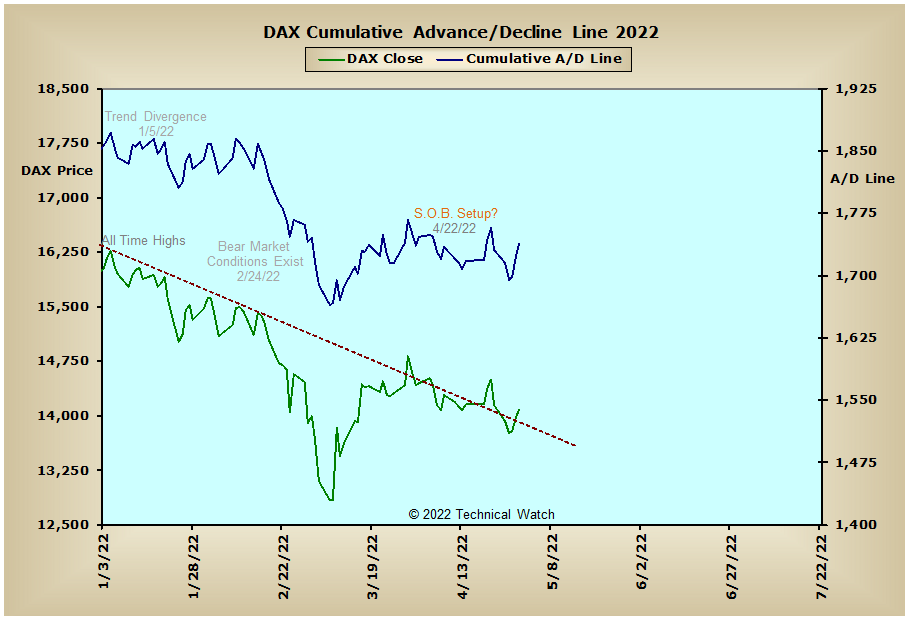
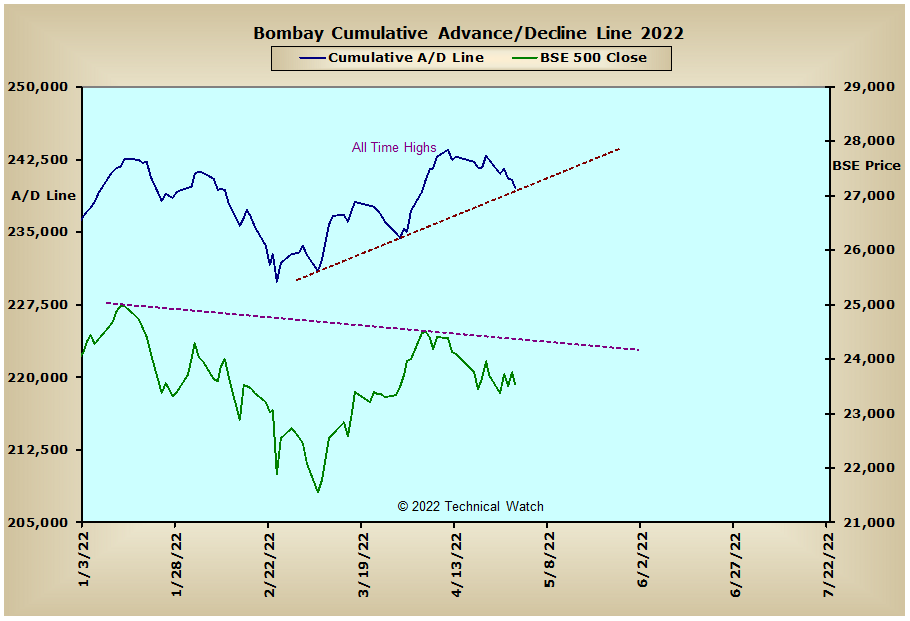
India: